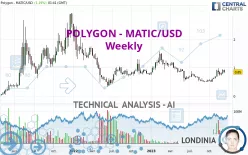
POLYGON - MATIC/USD - Weekly - Technical analysis published on 12/12/2023 (GMT)
- 153
- 0
Click here for a new analysis!
- Timeframe : Weekly
- - Analysis generated on
- Status : TARGET REACHED

Summary of the analysis

Additional analysis
Quotes
The POLYGON - MATIC/USD rating is 0.850000 USD. The price registered an increase of +4.94% over 5 days with the lowest point at 0.810000 USD and the highest point at 0.910000 USD. The deviation from the price is +4.94% for the low point and -6.59% for the high point.So that you have an overall view of the price change, here is a table showing the variations over several periods:
Abnormal volumes
Timeframe : 5 days
Abnormal volumes
Timeframe : 20 days
Abnormal volumes
Timeframe : 50 days
Technical
Technical analysis of POLYGON - MATIC/USD in Weekly shows a neutral overall trend. The strong bullish signals currently being given by short-term moving averages could allow the overall trend to return to bullish. The Central Indicators market scanner is currently detecting a bullish signal that could impact this trend:
Bullish trend reversal : adaptative moving average 100
Type : Bullish
Timeframe : Weekly
In fact, according to the parameters integrated into the Central Analyzer system, 16 technical indicators out of 18 analysed are currently bullish. Caution: the Central Indicators scanner currently detects an excess:
CCI indicator is overbought : over 100
Type : Neutral
Timeframe : Weekly
CCI indicator: bearish divergence
Type : Bearish
Timeframe : Weekly
RSI indicator: bearish divergence
Type : Bearish
Timeframe : Weekly
Price is back under the pivot point
Type : Bearish
Timeframe : Weekly
Central Patterns, the scanner specializing in chart patterns, did not identify any signals.
The Central Candlesticks scanner, specialised in Japanese candlesticks, did not identify any signals.
| S2 | S1 | Price | R1 | R2 | R3 | |
|---|---|---|---|---|---|---|
| ProTrendLines | 0.500000 | 0.694300 | 0.850000 | 1.032857 | 1.525000 | 2.448000 |
| Change (%) | -41.18% | -18.32% | - | +21.51% | +79.41% | +188.00% |
| Change | -0.350000 | -0.155700 | - | +0.182857 | +0.675000 | +1.598000 |
| Level | Intermediate | Intermediate | - | Minor | Intermediate | Minor |
To determine price objectives, it is also possible to use the pivot points. Here is the price position in relation to pivot points:
| Pivot points | S3 | S2 | S1 | PP | R1 | R2 | R3 |
|---|---|---|---|---|---|---|---|
| Standard | 0.656667 | 0.733333 | 0.786667 | 0.863333 | 0.916667 | 0.993333 | 1.046667 |
| Camarilla | 0.804250 | 0.816167 | 0.828083 | 0.840000 | 0.851917 | 0.863833 | 0.875750 |
| Woodie | 0.645000 | 0.727500 | 0.775000 | 0.857500 | 0.905000 | 0.987500 | 1.035000 |
| Fibonacci | 0.733333 | 0.782993 | 0.813673 | 0.863333 | 0.912993 | 0.943673 | 0.993333 |
| Pivot points | S3 | S2 | S1 | PP | R1 | R2 | R3 |
|---|---|---|---|---|---|---|---|
| Standard | 0.620000 | 0.700000 | 0.790000 | 0.870000 | 0.960000 | 1.040000 | 1.130000 |
| Camarilla | 0.833250 | 0.848833 | 0.864417 | 0.880000 | 0.895583 | 0.911167 | 0.926750 |
| Woodie | 0.625000 | 0.702500 | 0.795000 | 0.872500 | 0.965000 | 1.042500 | 1.135000 |
| Fibonacci | 0.700000 | 0.764940 | 0.805060 | 0.870000 | 0.934940 | 0.975060 | 1.040000 |
| Pivot points | S3 | S2 | S1 | PP | R1 | R2 | R3 |
|---|---|---|---|---|---|---|---|
| Standard | 0.233333 | 0.426667 | 0.593333 | 0.786667 | 0.953333 | 1.146667 | 1.313333 |
| Camarilla | 0.661000 | 0.694000 | 0.727000 | 0.760000 | 0.793000 | 0.826000 | 0.859000 |
| Woodie | 0.220000 | 0.420000 | 0.580000 | 0.780000 | 0.940000 | 1.140000 | 1.300000 |
| Fibonacci | 0.426667 | 0.564187 | 0.649147 | 0.786667 | 0.924187 | 1.009147 | 1.146667 |
Numerical data
The following is the status of technical indicators and moving averages registered at the time this technical analysis was created:
| RSI (14): | 56.40 | |
| MACD (12,26,9): | 0.0161 | |
| Directional Movement: | 17.458046 | |
| AROON (14): | 64.285714 | |
| DEMA (21): | 0.729979 | |
| Parabolic SAR (0,02-0,02-0,2): | 0.571294 | |
| Elder Ray (13): | 0.125311 | |
| Super Trend (3,10): | 0.545613 | |
| Zig ZAG (10): | 0.840000 | |
| VORTEX (21): | 1.0388 | |
| Stochastique (14,3,5): | 72.79 | |
| TEMA (21): | 0.804162 | |
| Williams %R (14): | -26.53 | |
| Chande Momentum Oscillator (20): | 0.340000 | |
| Repulse (5,40,3): | 2.5475 | |
| ROCnROLL: | 1 | |
| TRIX (15,9): | -0.6639 | |
| Courbe Coppock: | 82.75 |
| MA7: | 0.865714 | |
| MA20: | 0.809000 | |
| MA50: | 0.772600 | |
| MA100: | 0.654000 | |
| MAexp7: | 0.800731 | |
| MAexp20: | 0.734286 | |
| MAexp50: | 0.792825 | |
| MAexp100: | 0.845726 | |
| Price / MA7: | -1.82% | |
| Price / MA20: | +5.07% | |
| Price / MA50: | +10.02% | |
| Price / MA100: | +29.97% | |
| Price / MAexp7: | +6.15% | |
| Price / MAexp20: | +15.76% | |
| Price / MAexp50: | +7.21% | |
| Price / MAexp100: | +0.51% |
About author

Online


Add a comment
Comments
0 comments on the analysis POLYGON - MATIC/USD - Weekly