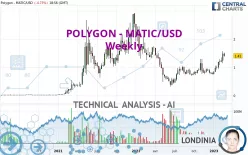
POLYGON - MATIC/USD - Weekly - Technical analysis published on 02/21/2023 (GMT)
- 181
- 0
Click here for a new analysis!
- Timeframe : Weekly
- - Analysis generated on
- Status : INVALID

Summary of the analysis

Additional analysis
Quotes
POLYGON - MATIC/USD rating 1.41 USD. Over 5 days, this instrument gained +6.02% and was traded between 1.37 USD and 1.57 USD over the period. The price is currently at +2.92% from its lowest point and -10.19% from its highest point.So that you have an overall view of the price change, here is a table showing the variations over several periods:
Near a new HIGH record (1 year)
Type : Bullish
Timeframe : Weekly
Near a new HIGH record (1st january)
Type : Bullish
Timeframe : Weekly
Near a new HIGH record (1 month)
Type : Bullish
Timeframe : Weekly
Technical
Technical analysis of POLYGON - MATIC/USD in Weekly shows a strongly overall bullish trend. 85.71% of the signals given by moving averages are bullish. This strongly bullish trend is supported by the strong bullish signals given by short-term moving averages. An assessment of moving averages reveals a bullish signal that could impact this trend:
Bullish trend reversal : Moving Average 50
Type : Bullish
Timeframe : Weekly
In fact, according to the parameters integrated into the Central Analyzer system, 15 technical indicators out of 18 analysed are currently bullish. Caution: the Central Indicators scanner currently detects an excess:
CCI indicator is overbought : over 100
Type : Neutral
Timeframe : Weekly
Previous candle closed over Bollinger bands
Type : Neutral
Timeframe : Weekly
Williams %R indicator is overbought : over -20
Type : Neutral
Timeframe : Weekly
The analysis of the price chart with Central Patterns scanners does not return any result.
No result was found by the Central Candlesticks scanner on Japanese candlesticks.
| S3 | S2 | S1 | Price | R1 | R2 | R3 | |
|---|---|---|---|---|---|---|---|
| ProTrendLines | 0.34 | 0.77 | 1.26 | 1.41 | 1.74 | 2.13 | 2.45 |
| Change (%) | -75.89% | -45.39% | -10.64% | - | +23.40% | +51.06% | +73.76% |
| Change | -1.07 | -0.64 | -0.15 | - | +0.33 | +0.72 | +1.04 |
| Level | Minor | Major | Major | - | Minor | Minor | Major |
To determine price objectives, it is also possible to use the pivot points. Here is the price position in relation to pivot points:
| Pivot points | S3 | S2 | S1 | PP | R1 | R2 | R3 |
|---|---|---|---|---|---|---|---|
| Standard | 1.36 | 1.39 | 1.44 | 1.47 | 1.52 | 1.55 | 1.60 |
| Camarilla | 1.46 | 1.47 | 1.47 | 1.48 | 1.49 | 1.50 | 1.50 |
| Woodie | 1.36 | 1.40 | 1.44 | 1.48 | 1.52 | 1.56 | 1.60 |
| Fibonacci | 1.39 | 1.42 | 1.44 | 1.47 | 1.50 | 1.52 | 1.55 |
| Pivot points | S3 | S2 | S1 | PP | R1 | R2 | R3 |
|---|---|---|---|---|---|---|---|
| Standard | 0.80 | 0.97 | 1.23 | 1.40 | 1.66 | 1.83 | 2.09 |
| Camarilla | 1.37 | 1.41 | 1.45 | 1.49 | 1.53 | 1.57 | 1.61 |
| Woodie | 0.85 | 0.99 | 1.28 | 1.42 | 1.71 | 1.85 | 2.14 |
| Fibonacci | 0.97 | 1.13 | 1.24 | 1.40 | 1.56 | 1.67 | 1.83 |
| Pivot points | S3 | S2 | S1 | PP | R1 | R2 | R3 |
|---|---|---|---|---|---|---|---|
| Standard | 0.42 | 0.60 | 0.85 | 1.03 | 1.28 | 1.46 | 1.71 |
| Camarilla | 0.99 | 1.03 | 1.07 | 1.11 | 1.15 | 1.19 | 1.23 |
| Woodie | 0.47 | 0.62 | 0.90 | 1.05 | 1.33 | 1.48 | 1.76 |
| Fibonacci | 0.60 | 0.76 | 0.86 | 1.03 | 1.19 | 1.29 | 1.46 |
Numerical data
The following is the status of technical indicators and moving averages registered at the time this technical analysis was created:
| RSI (14): | 66.01 | |
| MACD (12,26,9): | 0.1100 | |
| Directional Movement: | 22.97 | |
| AROON (14): | 50.00 | |
| DEMA (21): | 1.16 | |
| Parabolic SAR (0,02-0,02-0,2): | 0.87 | |
| Elder Ray (13): | 0.34 | |
| Super Trend (3,10): | 0.86 | |
| Zig ZAG (10): | 1.41 | |
| VORTEX (21): | 1.1700 | |
| Stochastique (14,3,5): | 84.13 | |
| TEMA (21): | 1.30 | |
| Williams %R (14): | -19.51 | |
| Chande Momentum Oscillator (20): | 0.49 | |
| Repulse (5,40,3): | 14.8500 | |
| ROCnROLL: | 1 | |
| TRIX (15,9): | 0.6000 | |
| Courbe Coppock: | 18.48 |
| MA7: | 1.44 | |
| MA20: | 1.31 | |
| MA50: | 1.10 | |
| MA100: | 0.98 | |
| MAexp7: | 1.24 | |
| MAexp20: | 1.05 | |
| MAexp50: | 1.02 | |
| MAexp100: | 0.96 | |
| Price / MA7: | -2.08% | |
| Price / MA20: | +7.63% | |
| Price / MA50: | +28.18% | |
| Price / MA100: | +43.88% | |
| Price / MAexp7: | +13.71% | |
| Price / MAexp20: | +34.29% | |
| Price / MAexp50: | +38.24% | |
| Price / MAexp100: | +46.88% |
About author

Online


Add a comment
Comments
0 comments on the analysis POLYGON - MATIC/USD - Weekly