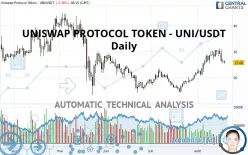
UNISWAP - UNI/USDT - Daily - Technical analysis published on 08/19/2021 (GMT)
- 175
- 0
- Timeframe : Daily
- - Analysis generated on
- Status : NEUTRAL

Summary of the analysis

Additional analysis
Quotes
UNISWAP PROTOCOL TOKEN - UNI/USDT rating 25.68 USDT. The price registered a decrease of -2.36% on the session and was traded between 25.32 USDT and 26.44 USDT over the period. The price is currently at +1.42% from its lowest and -2.87% from its highest.A bearish opening was detected by the Central Gaps scanner. Sellers are trying to impose a bearish trend in the very short term.
Bearish opening
Type : Bearish
Timeframe : Openning
Here is a more detailed summary of the historical variations registered by UNISWAP PROTOCOL TOKEN - UNI/USDT:
Technical
Technical analysis of UNISWAP PROTOCOL TOKEN - UNI/USDT in Daily shows an overall slightly bullish trend. 60.71% of the signals given by moving averages are bullish. As the signals currently given by short-term moving averages are rather neutral, the slightly bullish trend could return to neutral. There is no crossing of moving average by the price or crossing of moving averages between themselves.
On the 18 technical indicators analysed, 4 are bullish, 6 are neutral and 8 are bearish. Other results related to technical indicators were also found by the Central Indicators scanner:
Pivot points : price is under support 1
Type : Neutral
Timeframe : Weekly
Price is back over the pivot point
Type : Bullish
Timeframe : Weekly
Price is back under the pivot point
Type : Bearish
Timeframe : Daily
Williams %R indicator is back under -50
Type : Bearish
Timeframe : Daily
The Central Patterns scanner, which studies chart patterns, resistances and supports, has identified these signals:
Horizontal resistance is broken
Type : Bullish
Timeframe : Daily
Resistance of channel is broken
Type : Bullish
Timeframe : Daily
The Central Candlesticks scanner which studies Japanese candlesticks did not detect anything.
| S3 | S2 | S1 | Price | R1 | R2 | R3 | |
|---|---|---|---|---|---|---|---|
| ProTrendLines | 15.79 | 20.14 | 22.44 | 25.68 | 28.80 | 34.27 | 37.74 |
| Change (%) | -38.51% | -21.57% | -12.62% | - | +12.15% | +33.45% | +46.96% |
| Change | -9.89 | -5.54 | -3.24 | - | +3.12 | +8.59 | +12.06 |
| Level | Minor | Minor | Intermediate | - | Minor | Intermediate | Minor |
To determine price objectives, it is also possible to use the pivot points. Here is the price position in relation to pivot points:
| Pivot points | S3 | S2 | S1 | PP | R1 | R2 | R3 |
|---|---|---|---|---|---|---|---|
| Standard | 23.60 | 24.56 | 25.43 | 26.39 | 27.26 | 28.22 | 29.09 |
| Camarilla | 25.80 | 25.97 | 26.13 | 26.30 | 26.47 | 26.64 | 26.80 |
| Woodie | 23.56 | 24.54 | 25.39 | 26.37 | 27.22 | 28.20 | 29.05 |
| Fibonacci | 24.56 | 25.26 | 25.69 | 26.39 | 27.09 | 27.52 | 28.22 |
| Pivot points | S3 | S2 | S1 | PP | R1 | R2 | R3 |
|---|---|---|---|---|---|---|---|
| Standard | 21.55 | 23.47 | 26.79 | 28.71 | 32.03 | 33.95 | 37.27 |
| Camarilla | 28.67 | 29.15 | 29.63 | 30.11 | 30.59 | 31.07 | 31.55 |
| Woodie | 22.25 | 23.82 | 27.49 | 29.06 | 32.73 | 34.30 | 37.97 |
| Fibonacci | 23.47 | 25.47 | 26.71 | 28.71 | 30.71 | 31.95 | 33.95 |
| Pivot points | S3 | S2 | S1 | PP | R1 | R2 | R3 |
|---|---|---|---|---|---|---|---|
| Standard | 6.61 | 10.31 | 16.03 | 19.73 | 25.45 | 29.15 | 34.87 |
| Camarilla | 19.15 | 20.01 | 20.88 | 21.74 | 22.60 | 23.47 | 24.33 |
| Woodie | 7.61 | 10.82 | 17.03 | 20.24 | 26.45 | 29.66 | 35.87 |
| Fibonacci | 10.31 | 13.91 | 16.14 | 19.73 | 23.33 | 25.56 | 29.15 |
Numerical data
The following are the details of the technical indicators and moving averages that were collected to generate this technical analysis:
| RSI (14): | 52.55 | |
| MACD (12,26,9): | 1.8300 | |
| Directional Movement: | 0.37 | |
| AROON (14): | 78.57 | |
| DEMA (21): | 28.76 | |
| Parabolic SAR (0,02-0,02-0,2): | 31.02 | |
| Elder Ray (13): | -1.24 | |
| Super Trend (3,10): | 23.41 | |
| Zig ZAG (10): | 25.81 | |
| VORTEX (21): | 1.1400 | |
| Stochastique (14,3,5): | 40.07 | |
| TEMA (21): | 29.34 | |
| Williams %R (14): | -80.03 | |
| Chande Momentum Oscillator (20): | -2.41 | |
| Repulse (5,40,3): | -9.1200 | |
| ROCnROLL: | -1 | |
| TRIX (15,9): | 1.5700 | |
| Courbe Coppock: | 38.86 |
| MA7: | 28.37 | |
| MA20: | 26.52 | |
| MA50: | 21.84 | |
| MA100: | 23.16 | |
| MAexp7: | 27.40 | |
| MAexp20: | 26.18 | |
| MAexp50: | 23.87 | |
| MAexp100: | 23.82 | |
| Price / MA7: | -9.48% | |
| Price / MA20: | -3.17% | |
| Price / MA50: | +17.58% | |
| Price / MA100: | +10.88% | |
| Price / MAexp7: | -6.28% | |
| Price / MAexp20: | -1.91% | |
| Price / MAexp50: | +7.58% | |
| Price / MAexp100: | +7.81% |
About author

Online


Add a comment
Comments
0 comments on the analysis UNISWAP - UNI/USDT - Daily