| Open: | - |
| Change: | - |
| Volume: | - |
| Low: | - |
| High: | - |
| High / Low range: | - |
| Type: | Stocks |
| Ticker: | FNTN |
| ISIN: | DE000A0Z2ZZ5 |
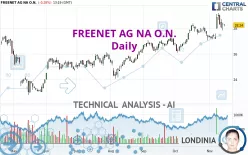
FREENET AG NA O.N. - Daily - Technical analysis published on 11/15/2024 (GMT)
- 78
- 0
- 11/15/2024 - 13:35
Click here for a new analysis!
- Timeframe : Daily
- - Analysis generated on 11/15/2024 - 13:35
- Status : TARGET REACHED

Summary of the analysis

Additional analysis
Quotes
The FREENET AG NA O.N. price is 28.24 EUR. The price registered a decrease of -0.28% on the session and was between 28.14 EUR and 28.34 EUR. This implies that the price is at +0.36% from its lowest and at -0.35% from its highest.A bearish opening was detected by the Central Gaps scanner. Sellers are trying to impose a bearish trend in the very short term.
Bearish opening
Type : Bearish
Timeframe : Openning
So that you have an overall view of the price change, here is a table showing the variations over several periods:
New HIGH record (5 years)
Type : Bullish
Timeframe : Weekly
Near a new HIGH record (1 year)
Type : Bullish
Timeframe : Weekly
Near a new HIGH record (1st january)
Type : Bullish
Timeframe : Weekly
Near a new LOW record (1 month)
Type : Bearish
Timeframe : Weekly
Technical
Technical analysis of FREENET AG NA O.N. in Daily shows a strongly overall bullish trend. 92.86% of the signals given by moving averages are bullish. The overall trend is supported by the strong bullish signals from short-term moving averages. There is no crossing of moving average by the price or crossing of moving averages between themselves.
An assessment of technical indicators shows a moderate bullish signal.
The Central Indicators scanner found this result concerning these indicators:
Price is back under the pivot point
Type : Bearish
Timeframe : Weekly
The analysis of the price chart with Central Patterns scanners does not return any result.
The Central Candlesticks scanner which studies Japanese candlesticks did not detect anything.
| S3 | S2 | S1 | Price | |
|---|---|---|---|---|
| ProTrendLines | 24.30 | 25.41 | 27.19 | 28.24 |
| Change (%) | -13.95% | -10.02% | -3.72% | - |
| Change | -3.94 | -2.83 | -1.05 | - |
| Level | Major | Intermediate | Major | - |
Pivot points can also be used to set your price objectives. Here is the price situation in relation to pivot points:
| Pivot points | S3 | S2 | S1 | PP | R1 | R2 | R3 |
|---|---|---|---|---|---|---|---|
| Standard | 27.35 | 27.59 | 27.95 | 28.19 | 28.55 | 28.79 | 29.15 |
| Camarilla | 28.16 | 28.21 | 28.27 | 28.32 | 28.38 | 28.43 | 28.49 |
| Woodie | 27.42 | 27.62 | 28.02 | 28.22 | 28.62 | 28.82 | 29.22 |
| Fibonacci | 27.59 | 27.82 | 27.96 | 28.19 | 28.42 | 28.56 | 28.79 |
| Pivot points | S3 | S2 | S1 | PP | R1 | R2 | R3 |
|---|---|---|---|---|---|---|---|
| Standard | 25.64 | 26.38 | 27.62 | 28.36 | 29.60 | 30.34 | 31.58 |
| Camarilla | 28.32 | 28.50 | 28.68 | 28.86 | 29.04 | 29.22 | 29.41 |
| Woodie | 25.89 | 26.51 | 27.87 | 28.49 | 29.85 | 30.47 | 31.83 |
| Fibonacci | 26.38 | 27.14 | 27.60 | 28.36 | 29.12 | 29.58 | 30.34 |
| Pivot points | S3 | S2 | S1 | PP | R1 | R2 | R3 |
|---|---|---|---|---|---|---|---|
| Standard | 23.83 | 24.95 | 26.13 | 27.25 | 28.43 | 29.55 | 30.73 |
| Camarilla | 26.67 | 26.88 | 27.09 | 27.30 | 27.51 | 27.72 | 27.93 |
| Woodie | 23.85 | 24.97 | 26.15 | 27.27 | 28.45 | 29.57 | 30.75 |
| Fibonacci | 24.95 | 25.83 | 26.38 | 27.25 | 28.13 | 28.68 | 29.55 |
Numerical data
The following is the status of the technical indicators and moving averages at the time of publication of this technical analysis:
| RSI (14): | 57.94 | |
| MACD (12,26,9): | 0.2900 | |
| Directional Movement: | 2.59 | |
| AROON (14): | 50.00 | |
| DEMA (21): | 28.26 | |
| Parabolic SAR (0,02-0,02-0,2): | 27.41 | |
| Elder Ray (13): | 0.20 | |
| Super Trend (3,10): | 27.49 | |
| Zig ZAG (10): | 28.28 | |
| VORTEX (21): | 0.9000 | |
| Stochastique (14,3,5): | 55.03 | |
| TEMA (21): | 28.30 | |
| Williams %R (14): | -42.45 | |
| Chande Momentum Oscillator (20): | 0.70 | |
| Repulse (5,40,3): | -0.7200 | |
| ROCnROLL: | 1 | |
| TRIX (15,9): | 0.1300 | |
| Courbe Coppock: | 2.98 |
| MA7: | 28.30 | |
| MA20: | 27.86 | |
| MA50: | 27.31 | |
| MA100: | 26.43 | |
| MAexp7: | 28.19 | |
| MAexp20: | 27.89 | |
| MAexp50: | 27.33 | |
| MAexp100: | 26.61 | |
| Price / MA7: | -0.21% | |
| Price / MA20: | +1.36% | |
| Price / MA50: | +3.41% | |
| Price / MA100: | +6.85% | |
| Price / MAexp7: | +0.18% | |
| Price / MAexp20: | +1.25% | |
| Price / MAexp50: | +3.33% | |
| Price / MAexp100: | +6.13% |
News
The last news published on FREENET AG NA O.N. at the time of the generation of this analysis was as follows:
- UNKNOWN: Use of undefined constant WEBP_SUPPORTED - assumed 'WEBP_SUPPORTED' (this will throw an Error in a future version of PHP) in /www/prod/library/CC/View/Helper/SwitchPngWebp.php on line 11
- 11/08/2024 - 11:25 EQS-News: freenet Executive Board formulates financial ambition until 2028 - EBITDA and free cash flow to grow significantly UNKNOWN: Use of undefined constant WEBP_SUPPORTED - assumed 'WEBP_SUPPORTED' (this will throw an Error in a future version of PHP) in /www/prod/library/CC/View/Helper/SwitchPngWebp.php on line 11
- 11/07/2024 - 17:01 EQS-News: freenet continues successful development in 2024 – performance allows for specification and partial increase of 2024 financial guidance UNKNOWN: Use of undefined constant WEBP_SUPPORTED - assumed 'WEBP_SUPPORTED' (this will throw an Error in a future version of PHP) in /www/prod/library/CC/View/Helper/SwitchPngWebp.php on line 11
- 08/07/2024 - 16:00 EQS-News: Another record growth in waipu.tv customers - 2024 Guidance confirmed UNKNOWN: Use of undefined constant WEBP_SUPPORTED - assumed 'WEBP_SUPPORTED' (this will throw an Error in a future version of PHP) in /www/prod/library/CC/View/Helper/SwitchPngWebp.php on line 11
- 07/21/2024 - 20:39 EQS-Adhoc: freenet AG: CEO Christoph Vilanek is not available for an extension of his term of office UNKNOWN: Use of undefined constant WEBP_SUPPORTED - assumed 'WEBP_SUPPORTED' (this will throw an Error in a future version of PHP) in /www/prod/library/CC/View/Helper/SwitchPngWebp.php on line 11
- 05/15/2024 - 16:02 EQS-News: freenet successfully starts 2024 - very dynamic growth in IPTV customers
About author
Online


Add a comment
Comments
0 comments on the analysis FREENET AG NA O.N. - Daily