FREENET AG NA O.N. - 1H - Technical analysis published on 11/14/2024 (GMT)
- 95
- 0
Click here for a new analysis!
- Timeframe : 1H
- - Analysis generated on
- Status : INVALID
Summary of the analysis

Additional analysis
Quotes
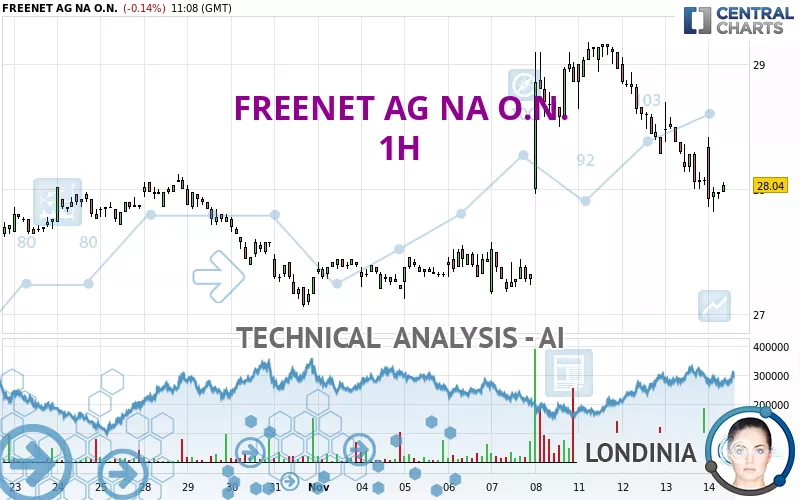
The FREENET AG NA O.N. rating is 28.04 EUR. On the day, this instrument lost -0.14% with the lowest point at 27.82 EUR and the highest point at 28.42 EUR. The deviation from the price is +0.79% for the low point and -1.34% for the high point.The Central Gaps scanner detects a bullish opening. A small advantage for buyers in the very short term.
Bullish opening
Type : Bullish
Timeframe : Openning
Here is a more detailed summary of the historical variations registered by FREENET AG NA O.N.:
New HIGH record (5 years)
Type : Bullish
Timeframe : Weekly
Near a new HIGH record (1 year)
Type : Bullish
Timeframe : Weekly
Near a new HIGH record (1st january)
Type : Bullish
Timeframe : Weekly
Near a new HIGH record (1 month)
Type : Bullish
Timeframe : Weekly
Technical
Technical analysis of this 1H chart of FREENET AG NA O.N. indicates that the overall trend is slightly bearish. 46.43% of the signals given by moving averages are bearish. This bearish trend does not seem to be increasing given the slightly bearish signals given by short-term moving averages. There is no crossing of moving average by the price or crossing of moving averages between themselves.
On the 18 technical indicators analysed, 5 are bullish, 4 are neutral and 9 are bearish. But beware of excesses. The Central Indicators scanner currently detects this:
CCI indicator is oversold : under -100
Type : Neutral
Timeframe : 1 hour
CCI indicator: bullish divergence
Type : Bullish
Timeframe : 1 hour
Williams %R indicator is oversold : under -80
Type : Neutral
Timeframe : 1 hour
Price is back under the pivot point
Type : Bearish
Timeframe : Weekly
The Central Patterns scanner, which studies chart patterns, resistances and supports, has identified these signals:
Near horizontal support
Type : Bullish
Timeframe : 1 hour
Near support of channel
Type : Bullish
Timeframe : 1 hour
The Central Candlesticks scanner currently notes the presence of this pattern in Japanese candlesticks that could mark the end of the short-term trend currently underway:
Doji
Type : Neutral
Timeframe : 1 hour
| S3 | S2 | S1 | Price | R1 | R2 | R3 | |
|---|---|---|---|---|---|---|---|
| ProTrendLines | 27.19 | 27.52 | 27.72 | 28.04 | 28.22 | 28.38 | 28.70 |
| Change (%) | -3.03% | -1.85% | -1.14% | - | +0.64% | +1.21% | +2.35% |
| Change | -0.85 | -0.52 | -0.32 | - | +0.18 | +0.34 | +0.66 |
| Level | Major | Minor | Intermediate | - | Major | Intermediate | Minor |
Pivot points can also be used to set your price objectives. Here is the price situation in relation to pivot points:
| Pivot points | S3 | S2 | S1 | PP | R1 | R2 | R3 |
|---|---|---|---|---|---|---|---|
| Standard | 27.12 | 27.56 | 27.82 | 28.26 | 28.52 | 28.96 | 29.22 |
| Camarilla | 27.89 | 27.95 | 28.02 | 28.08 | 28.14 | 28.21 | 28.27 |
| Woodie | 27.03 | 27.52 | 27.73 | 28.22 | 28.43 | 28.92 | 29.13 |
| Fibonacci | 27.56 | 27.83 | 27.99 | 28.26 | 28.53 | 28.69 | 28.96 |
| Pivot points | S3 | S2 | S1 | PP | R1 | R2 | R3 |
|---|---|---|---|---|---|---|---|
| Standard | 25.64 | 26.38 | 27.62 | 28.36 | 29.60 | 30.34 | 31.58 |
| Camarilla | 28.32 | 28.50 | 28.68 | 28.86 | 29.04 | 29.22 | 29.41 |
| Woodie | 25.89 | 26.51 | 27.87 | 28.49 | 29.85 | 30.47 | 31.83 |
| Fibonacci | 26.38 | 27.14 | 27.60 | 28.36 | 29.12 | 29.58 | 30.34 |
| Pivot points | S3 | S2 | S1 | PP | R1 | R2 | R3 |
|---|---|---|---|---|---|---|---|
| Standard | 23.83 | 24.95 | 26.13 | 27.25 | 28.43 | 29.55 | 30.73 |
| Camarilla | 26.67 | 26.88 | 27.09 | 27.30 | 27.51 | 27.72 | 27.93 |
| Woodie | 23.85 | 24.97 | 26.15 | 27.27 | 28.45 | 29.57 | 30.75 |
| Fibonacci | 24.95 | 25.83 | 26.38 | 27.25 | 28.13 | 28.68 | 29.55 |
Numerical data
The following are the details of the technical indicators and moving averages that were collected to generate this technical analysis:
| RSI (14): | 35.47 | |
| MACD (12,26,9): | -0.1500 | |
| Directional Movement: | -1.17 | |
| AROON (14): | -71.43 | |
| DEMA (21): | 28.12 | |
| Parabolic SAR (0,02-0,02-0,2): | 28.67 | |
| Elder Ray (13): | -0.23 | |
| Super Trend (3,10): | 28.53 | |
| Zig ZAG (10): | 27.96 | |
| VORTEX (21): | 0.6900 | |
| Stochastique (14,3,5): | 14.50 | |
| TEMA (21): | 27.89 | |
| Williams %R (14): | -81.82 | |
| Chande Momentum Oscillator (20): | -0.30 | |
| Repulse (5,40,3): | -0.6600 | |
| ROCnROLL: | 2 | |
| TRIX (15,9): | -0.0500 | |
| Courbe Coppock: | 3.88 |
| MA7: | 28.13 | |
| MA20: | 27.83 | |
| MA50: | 27.27 | |
| MA100: | 26.39 | |
| MAexp7: | 28.04 | |
| MAexp20: | 28.28 | |
| MAexp50: | 28.26 | |
| MAexp100: | 28.05 | |
| Price / MA7: | -0.32% | |
| Price / MA20: | +0.75% | |
| Price / MA50: | +2.82% | |
| Price / MA100: | +6.25% | |
| Price / MAexp7: | -0% | |
| Price / MAexp20: | -0.85% | |
| Price / MAexp50: | -0.78% | |
| Price / MAexp100: | -0.04% |
News
The latest news and videos published on FREENET AG NA O.N. at the time of the analysis were as follows:
- EQS-News: freenet Executive Board formulates financial ambition until 2028 - EBITDA and free cash flow to grow significantly
- EQS-News: freenet continues successful development in 2024 – performance allows for specification and partial increase of 2024 financial guidance
- EQS-News: Another record growth in waipu.tv customers - 2024 Guidance confirmed
- EQS-Adhoc: freenet AG: CEO Christoph Vilanek is not available for an extension of his term of office
- EQS-News: freenet successfully starts 2024 - very dynamic growth in IPTV customers
About author
Online


Add a comment
Comments
0 comments on the analysis FREENET AG NA O.N. - 1H