FREENET AG NA O.N. - 1H - Technical analysis published on 11/12/2024 (GMT)
- 130
- 0
Click here for a new analysis!
- Timeframe : 1H
- - Analysis generated on
- Status : INVALID
Summary of the analysis

Additional analysis
Quotes
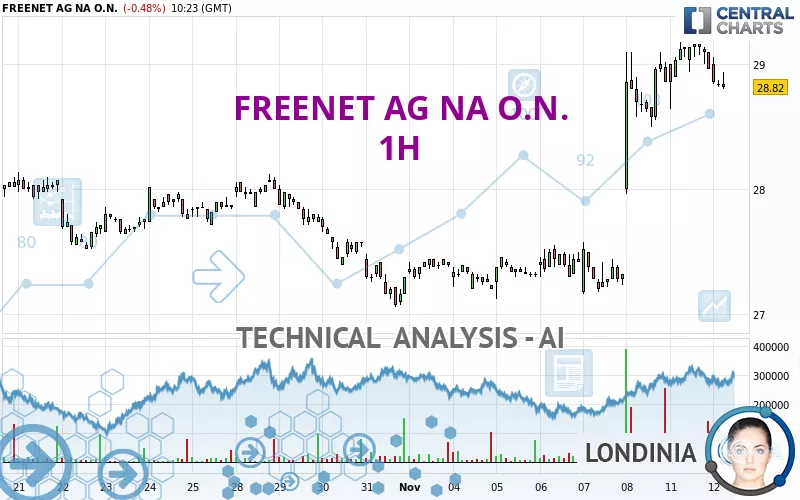
The FREENET AG NA O.N. rating is 28.82 EUR. The price is lower by -0.48% since the last closing and was traded between 28.80 EUR and 29.06 EUR over the period. The price is currently at +0.07% from its lowest and -0.83% from its highest.The Central Gaps scanner detects a bullish opening. A small advantage for buyers in the very short term.
Bullish opening
Type : Bullish
Timeframe : Openning
So that you have an overall view of the price change, here is a table showing the variations over several periods:
New HIGH record (5 years)
Type : Bullish
Timeframe : Weekly
Near a new HIGH record (1 year)
Type : Bullish
Timeframe : Weekly
Near a new HIGH record (1st january)
Type : Bullish
Timeframe : Weekly
Near a new HIGH record (1 month)
Type : Bullish
Timeframe : Weekly
Technical
Technical analysis of this 1H chart of FREENET AG NA O.N. indicates that the overall trend is strongly bullish. The signals given by moving averages are 85.71% bullish. This strongly bullish trend seems to be running out of steam given the signals being given by short-term moving averages. The Central Indicators scanner does not detect any result on moving averages that would impact this trend.
In fact, Central Analyzer took into account 18 technical indicators and the result was as follows: 3 are bullish, 9 are neutral and 6 are bearish. The Central Indicators scanner found this result concerning these indicators:
Momentum indicator is back over 0
Type : Bullish
Timeframe : 1 hour
The Central Patterns scanner, which studies chart patterns, resistances and supports, has identified this signal:
Support of channel is broken
Type : Bearish
Timeframe : 1 hour
The Central Candlesticks scanner, specialised in Japanese candlesticks, did not identify any signals.
| S3 | S2 | S1 | Price | R1 | |
|---|---|---|---|---|---|
| ProTrendLines | 27.16 | 27.72 | 28.22 | 28.82 | 29.10 |
| Change (%) | -5.76% | -3.82% | -2.08% | - | +0.97% |
| Change | -1.66 | -1.10 | -0.60 | - | +0.28 |
| Level | Minor | Minor | Major | - | Intermediate |
To determine price objectives, it is also possible to use the pivot points. Here is the price position in relation to pivot points:
| Pivot points | S3 | S2 | S1 | PP | R1 | R2 | R3 |
|---|---|---|---|---|---|---|---|
| Standard | 28.13 | 28.39 | 28.67 | 28.93 | 29.21 | 29.47 | 29.75 |
| Camarilla | 28.81 | 28.86 | 28.91 | 28.96 | 29.01 | 29.06 | 29.11 |
| Woodie | 28.15 | 28.40 | 28.69 | 28.94 | 29.23 | 29.48 | 29.77 |
| Fibonacci | 28.39 | 28.59 | 28.72 | 28.93 | 29.13 | 29.26 | 29.47 |
| Pivot points | S3 | S2 | S1 | PP | R1 | R2 | R3 |
|---|---|---|---|---|---|---|---|
| Standard | 25.64 | 26.38 | 27.62 | 28.36 | 29.60 | 30.34 | 31.58 |
| Camarilla | 28.32 | 28.50 | 28.68 | 28.86 | 29.04 | 29.22 | 29.41 |
| Woodie | 25.89 | 26.51 | 27.87 | 28.49 | 29.85 | 30.47 | 31.83 |
| Fibonacci | 26.38 | 27.14 | 27.60 | 28.36 | 29.12 | 29.58 | 30.34 |
| Pivot points | S3 | S2 | S1 | PP | R1 | R2 | R3 |
|---|---|---|---|---|---|---|---|
| Standard | 23.83 | 24.95 | 26.13 | 27.25 | 28.43 | 29.55 | 30.73 |
| Camarilla | 26.67 | 26.88 | 27.09 | 27.30 | 27.51 | 27.72 | 27.93 |
| Woodie | 23.85 | 24.97 | 26.15 | 27.27 | 28.45 | 29.57 | 30.75 |
| Fibonacci | 24.95 | 25.83 | 26.38 | 27.25 | 28.13 | 28.68 | 29.55 |
Numerical data
The following is the status of technical indicators and moving averages registered at the time this technical analysis was created:
| RSI (14): | 59.87 | |
| MACD (12,26,9): | 0.3000 | |
| Directional Movement: | 6.21 | |
| AROON (14): | 42.86 | |
| DEMA (21): | 29.18 | |
| Parabolic SAR (0,02-0,02-0,2): | 28.00 | |
| Elder Ray (13): | -0.06 | |
| Super Trend (3,10): | 28.52 | |
| Zig ZAG (10): | 28.86 | |
| VORTEX (21): | 1.1600 | |
| Stochastique (14,3,5): | 56.33 | |
| TEMA (21): | 29.23 | |
| Williams %R (14): | -51.61 | |
| Chande Momentum Oscillator (20): | -0.14 | |
| Repulse (5,40,3): | -0.4800 | |
| ROCnROLL: | -1 | |
| TRIX (15,9): | 0.2000 | |
| Courbe Coppock: | 2.84 |
| MA7: | 27.99 | |
| MA20: | 27.88 | |
| MA50: | 27.24 | |
| MA100: | 26.33 | |
| MAexp7: | 28.96 | |
| MAexp20: | 28.75 | |
| MAexp50: | 28.25 | |
| MAexp100: | 27.94 | |
| Price / MA7: | +2.97% | |
| Price / MA20: | +3.37% | |
| Price / MA50: | +5.80% | |
| Price / MA100: | +9.46% | |
| Price / MAexp7: | -0.48% | |
| Price / MAexp20: | +0.24% | |
| Price / MAexp50: | +2.02% | |
| Price / MAexp100: | +3.15% |
News
The latest news and videos published on FREENET AG NA O.N. at the time of the analysis were as follows:
- EQS-News: freenet Executive Board formulates financial ambition until 2028 - EBITDA and free cash flow to grow significantly
- EQS-News: freenet continues successful development in 2024 – performance allows for specification and partial increase of 2024 financial guidance
- EQS-News: Another record growth in waipu.tv customers - 2024 Guidance confirmed
- EQS-Adhoc: freenet AG: CEO Christoph Vilanek is not available for an extension of his term of office
- EQS-News: freenet successfully starts 2024 - very dynamic growth in IPTV customers
About author
Online


Add a comment
Comments
0 comments on the analysis FREENET AG NA O.N. - 1H