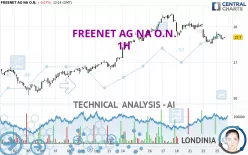
FREENET AG NA O.N. - 1H - Technical analysis published on 10/23/2024 (GMT)
- 98
- 0
Click here for a new analysis!
- Timeframe : 1H
- - Analysis generated on
- Status : LEVEL MAINTAINED

Summary of the analysis

Additional analysis
Quotes
The FREENET AG NA O.N. rating is 27.70 EUR. The price is lower by -0.07% since the last closing and was between 27.64 EUR and 27.86 EUR. This implies that the price is at +0.22% from its lowest and at -0.57% from its highest.A study of price movements over other periods shows the following variations:
Near a new HIGH record (5 years)
Type : Bullish
Timeframe : Weekly
Near a new HIGH record (1 year)
Type : Bullish
Timeframe : Weekly
Near a new HIGH record (1st january)
Type : Bullish
Timeframe : Weekly
Near a new HIGH record (1 month)
Type : Bullish
Timeframe : Weekly
Technical
A technical analysis in 1H of this FREENET AG NA O.N. chart shows a neutral trend. This indecision could turn into a bearish trend due to the strong bearish signals currently being given by short-term moving averages. The Central Indicators scanner does not detect any result on moving averages that would impact this trend.
In fact, Central Analyzer took into account 18 technical indicators and the result was as follows: 6 are bullish, 4 are neutral and 8 are bearish. Central Indicators, the scanner specialised in technical indicators, has identified this signal:
Price is back under the pivot point
Type : Bearish
Timeframe : Weekly
An analysis of the price chart with the Central Patterns scanner (detector of chart patterns and resistances and supports) shows a result that can have an impact on the price change:
Near horizontal resistance
Type : Bearish
Timeframe : 1 hour
There is also a Japanese candlestick pattern detected by Central Candlesticks that could mark the end of the current short-term trend:
Doji
Type : Neutral
Timeframe : 1 hour
| S3 | S2 | S1 | Price | R1 | R2 | |
|---|---|---|---|---|---|---|
| ProTrendLines | 26.63 | 26.95 | 27.18 | 27.70 | 27.72 | 28.22 |
| Change (%) | -3.86% | -2.71% | -1.88% | - | +0.07% | +1.88% |
| Change | -1.07 | -0.75 | -0.52 | - | +0.02 | +0.52 |
| Level | Minor | Minor | Major | - | Minor | Major |
To determine price objectives, it is also possible to use the pivot points. Here is the price position in relation to pivot points:
| Pivot points | S3 | S2 | S1 | PP | R1 | R2 | R3 |
|---|---|---|---|---|---|---|---|
| Standard | 27.12 | 27.32 | 27.52 | 27.72 | 27.92 | 28.12 | 28.32 |
| Camarilla | 27.61 | 27.65 | 27.68 | 27.72 | 27.76 | 27.79 | 27.83 |
| Woodie | 27.12 | 27.32 | 27.52 | 27.72 | 27.92 | 28.12 | 28.32 |
| Fibonacci | 27.32 | 27.47 | 27.57 | 27.72 | 27.87 | 27.97 | 28.12 |
| Pivot points | S3 | S2 | S1 | PP | R1 | R2 | R3 |
|---|---|---|---|---|---|---|---|
| Standard | 26.04 | 26.58 | 27.30 | 27.84 | 28.56 | 29.10 | 29.82 |
| Camarilla | 27.67 | 27.79 | 27.91 | 28.02 | 28.14 | 28.25 | 28.37 |
| Woodie | 26.13 | 26.63 | 27.39 | 27.89 | 28.65 | 29.15 | 29.91 |
| Fibonacci | 26.58 | 27.06 | 27.36 | 27.84 | 28.32 | 28.62 | 29.10 |
| Pivot points | S3 | S2 | S1 | PP | R1 | R2 | R3 |
|---|---|---|---|---|---|---|---|
| Standard | 25.04 | 25.60 | 26.16 | 26.72 | 27.28 | 27.84 | 28.40 |
| Camarilla | 26.41 | 26.52 | 26.62 | 26.72 | 26.82 | 26.93 | 27.03 |
| Woodie | 25.04 | 25.60 | 26.16 | 26.72 | 27.28 | 27.84 | 28.40 |
| Fibonacci | 25.60 | 26.03 | 26.29 | 26.72 | 27.15 | 27.41 | 27.84 |
Numerical data
The following is the status of the technical indicators and moving averages at the time of publication of this technical analysis:
| RSI (14): | 43.13 | |
| MACD (12,26,9): | -0.0700 | |
| Directional Movement: | -6.36 | |
| AROON (14): | -42.86 | |
| DEMA (21): | 27.69 | |
| Parabolic SAR (0,02-0,02-0,2): | 27.85 | |
| Elder Ray (13): | -0.07 | |
| Super Trend (3,10): | 27.90 | |
| Zig ZAG (10): | 27.70 | |
| VORTEX (21): | 0.8200 | |
| Stochastique (14,3,5): | 37.62 | |
| TEMA (21): | 27.63 | |
| Williams %R (14): | -55.00 | |
| Chande Momentum Oscillator (20): | -0.04 | |
| Repulse (5,40,3): | 0.1600 | |
| ROCnROLL: | 2 | |
| TRIX (15,9): | -0.0400 | |
| Courbe Coppock: | 1.58 |
| MA7: | 27.96 | |
| MA20: | 27.22 | |
| MA50: | 26.69 | |
| MA100: | 25.97 | |
| MAexp7: | 27.71 | |
| MAexp20: | 27.77 | |
| MAexp50: | 27.78 | |
| MAexp100: | 27.59 | |
| Price / MA7: | -0.93% | |
| Price / MA20: | +1.76% | |
| Price / MA50: | +3.78% | |
| Price / MA100: | +6.66% | |
| Price / MAexp7: | -0.04% | |
| Price / MAexp20: | -0.25% | |
| Price / MAexp50: | -0.29% | |
| Price / MAexp100: | +0.40% |
News
The latest news and videos published on FREENET AG NA O.N. at the time of the analysis were as follows:
- EQS-News: Another record growth in waipu.tv customers - 2024 Guidance confirmed
- EQS-Adhoc: freenet AG: CEO Christoph Vilanek is not available for an extension of his term of office
- EQS-News: freenet successfully starts 2024 - very dynamic growth in IPTV customers
- EQS-News: freenet Annual General Meeting approves dividend increase of more than 5 %
- EQS-News: freenet confirms the preliminary results for the 2023 financial year, the proposed dividend of EUR 1.77 and the 2024 guidance
About author
Online


Add a comment
Comments
0 comments on the analysis FREENET AG NA O.N. - 1H