| Open: | - |
| Change: | - |
| Volume: | - |
| Low: | - |
| High: | - |
| High / Low range: | - |
| Type: | Stocks |
| Ticker: | LECN |
| ISIN: | CH0110303119 |
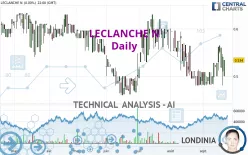
LECLANCHE N - Daily - Technical analysis published on 09/22/2023 (GMT)
- 216
- 0
- 09/22/2023 - 11:20
Click here for a new analysis!
- Timeframe : Daily
- - Analysis generated on 09/22/2023 - 11:20
- Status : INVALID

Summary of the analysis

Additional analysis
Quotes
The LECLANCHE N price is 0.5560 CHF. The price registered an increase of +4.12% on the session with the lowest point at 0.5560 CHF and the highest point at 0.5560 CHF. The deviation from the price is 0% for the low point and 0% for the high point.A bullish gap was detected at the opening by the Central Gaps scanner. There are a lot of buyers and they have the upper hand in the very short term.
Opening Gap UP
Type : Bullish
Timeframe : Openning
So that you have an overall view of the price change, here is a table showing the variations over several periods:
Near a new HIGH record (1 month)
Type : Bullish
Timeframe : Weekly
Technical
Technical analysis of LECLANCHE N in Daily shows an overall slightly bullish trend. Only 57.14% of the signals given by moving averages are bullish. This slightly bullish trend is reinforced by the strong signals currently being given by short-term moving averages. An assessment of moving averages reveals several bullish signals that could impact this trend:
Bullish price crossover with Moving Average 50
Type : Bullish
Timeframe : Daily
Bullish price crossover with Moving Average 100
Type : Bullish
Timeframe : Daily
Bullish price crossover with adaptative moving average 50
Type : Bullish
Timeframe : Daily
Bullish price crossover with adaptative moving average 100
Type : Bullish
Timeframe : Daily
The probability of a further increase is high given the direction of the technical indicators.
But beware of excesses. The Central Indicators scanner currently detects this:
CCI indicator is overbought : over 100
Type : Neutral
Timeframe : Daily
Williams %R indicator is overbought : over -20
Type : Neutral
Timeframe : Daily
Pivot points : price is over resistance 1
Type : Neutral
Timeframe : Daily
Central Patterns, the market scanner focusing on chart patterns, resistances and supports found this result:
Near resistance of channel
Type : Bearish
Timeframe : Daily
Central Candlesticks, the scanner specialised in Japanese candlesticks, detects these signals that could have an impact on the current short-term trend:
Bearish doji star
Type : Bearish
Timeframe : Daily
Doji
Type : Neutral
Timeframe : Daily
| S3 | S2 | S1 | Price | R1 | R2 | R3 | |
|---|---|---|---|---|---|---|---|
| ProTrendLines | 0.4814 | 0.5090 | 0.5400 | 0.5560 | 0.5620 | 0.5780 | 0.5960 |
| Change (%) | -13.42% | -8.45% | -2.88% | - | +1.08% | +3.96% | +7.19% |
| Change | -0.0746 | -0.0470 | -0.0160 | - | +0.0060 | +0.0220 | +0.0400 |
| Level | Intermediate | Minor | Minor | - | Minor | Minor | Minor |
Pivot points can also be used to set your price objectives. Here is the price situation in relation to pivot points:
| Pivot points | S3 | S2 | S1 | PP | R1 | R2 | R3 |
|---|---|---|---|---|---|---|---|
| Standard | 0.4773 | 0.4887 | 0.5113 | 0.5227 | 0.5453 | 0.5567 | 0.5793 |
| Camarilla | 0.5247 | 0.5278 | 0.5309 | 0.5340 | 0.5371 | 0.5402 | 0.5434 |
| Woodie | 0.4830 | 0.4915 | 0.5170 | 0.5255 | 0.5510 | 0.5595 | 0.5850 |
| Fibonacci | 0.4887 | 0.5017 | 0.5097 | 0.5227 | 0.5357 | 0.5437 | 0.5567 |
| Pivot points | S3 | S2 | S1 | PP | R1 | R2 | R3 |
|---|---|---|---|---|---|---|---|
| Standard | 0.4303 | 0.4567 | 0.5093 | 0.5357 | 0.5883 | 0.6147 | 0.6673 |
| Camarilla | 0.5403 | 0.5475 | 0.5548 | 0.5620 | 0.5692 | 0.5765 | 0.5837 |
| Woodie | 0.4435 | 0.4633 | 0.5225 | 0.5423 | 0.6015 | 0.6213 | 0.6805 |
| Fibonacci | 0.4567 | 0.4868 | 0.5055 | 0.5357 | 0.5658 | 0.5845 | 0.6147 |
| Pivot points | S3 | S2 | S1 | PP | R1 | R2 | R3 |
|---|---|---|---|---|---|---|---|
| Standard | 0.3387 | 0.4093 | 0.4587 | 0.5293 | 0.5787 | 0.6493 | 0.6987 |
| Camarilla | 0.4750 | 0.4860 | 0.4970 | 0.5080 | 0.5190 | 0.5300 | 0.5410 |
| Woodie | 0.3280 | 0.4040 | 0.4480 | 0.5240 | 0.5680 | 0.6440 | 0.6880 |
| Fibonacci | 0.4093 | 0.4552 | 0.4835 | 0.5293 | 0.5752 | 0.6035 | 0.6493 |
Numerical data
The following are the details of the technical indicators and moving averages that were collected to generate this technical analysis:
| RSI (14): | 56.62 | |
| MACD (12,26,9): | 0.0057 | |
| Directional Movement: | -3.4404 | |
| AROON (14): | 71.4286 | |
| DEMA (21): | 0.5328 | |
| Parabolic SAR (0,02-0,02-0,2): | 0.5626 | |
| Elder Ray (13): | 0.0222 | |
| Super Trend (3,10): | 0.5748 | |
| Zig ZAG (10): | 0.5560 | |
| VORTEX (21): | 0.9923 | |
| Stochastique (14,3,5): | 73.64 | |
| TEMA (21): | 0.5460 | |
| Williams %R (14): | -11.63 | |
| Chande Momentum Oscillator (20): | 0.0580 | |
| Repulse (5,40,3): | 15.1551 | |
| ROCnROLL: | 1 | |
| TRIX (15,9): | -0.0669 | |
| Courbe Coppock: | 19.52 |
| MA7: | 0.5474 | |
| MA20: | 0.5158 | |
| MA50: | 0.5454 | |
| MA100: | 0.5443 | |
| MAexp7: | 0.5425 | |
| MAexp20: | 0.5297 | |
| MAexp50: | 0.5344 | |
| MAexp100: | 0.5451 | |
| Price / MA7: | +1.57% | |
| Price / MA20: | +7.79% | |
| Price / MA50: | +1.94% | |
| Price / MA100: | +2.15% | |
| Price / MAexp7: | +2.49% | |
| Price / MAexp20: | +4.97% | |
| Price / MAexp50: | +4.04% | |
| Price / MAexp100: | +2.00% |
News
The latest news and videos published on LECLANCHE N at the time of the analysis were as follows:
- 09/13/2023 - 17:00 Leclanché SA: Leclanché Selected to Supply Battery Systems for a Second Pair of CMAL Hybrid Ferries Serving Scotland’s Outer Hebrides Islands
- 06/28/2023 - 04:55 Leclanché SA revolutionary battery pack is selected by Socofer to equip brand new hybrid maintenance locomotives in the Channel Tunnel
- 06/26/2023 - 18:00 Leclanché SA concludes its 2023 Annual General Meeting
- 06/26/2023 - 04:55 Leclanché SA Named ‘Marine Industry Supplier of the Year’ by Electric and Hybrid Marine Technology International Magazine
- 06/19/2023 - 18:45 Leclanché SA: Publishes a Detailed Management Report in View of the June 26 General Assembly Meeting
About author
Online


Add a comment
Comments
0 comments on the analysis LECLANCHE N - Daily