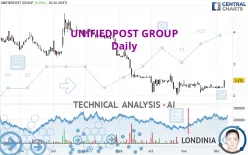
UNIFIEDPOST GROUP - Daily - Technical analysis published on 12/11/2023 (GMT)
- 184
- 0
Click here for a new analysis!
- Timeframe : Daily
- - Analysis generated on
- Status : TARGET REACHED

Summary of the analysis

Additional analysis
Quotes
UNIFIEDPOST GROUP rating 2.475 EUR. On the day, this instrument gained +9.03% and was traded between 2.250 EUR and 2.475 EUR over the period. The price is currently at +10.00% from its lowest and 0% from its highest.A bearish opening was detected by the Central Gaps scanner. Sellers are trying to impose a bearish trend in the very short term.
Bearish opening
Type : Bearish
Timeframe : Openning
A study of price movements over other periods shows the following variations:
New HIGH record (1 month)
Type : Bullish
Timeframe : Weekly
Technical
Technical analysis of UNIFIEDPOST GROUP in Daily shows an overall slightly bearish trend. Only 57.14% of the signals given by moving averages are bearish. This slightly bearish trend could quickly be reversed due to the strong bullish signals currently being given by short-term moving averages. An assessment of moving averages reveals several bullish signals that could impact this trend:
Bullish price crossover with Moving Average 50
Type : Bullish
Timeframe : Daily
Bullish price crossover with adaptative moving average 20
Type : Bullish
Timeframe : Daily
Bullish price crossover with adaptative moving average 50
Type : Bullish
Timeframe : Daily
The probability of a further increase is high given the direction of the technical indicators.
But beware of excesses. The Central Indicators scanner currently detects this:
CCI indicator is overbought : over 100
Type : Neutral
Timeframe : Daily
Williams %R indicator is overbought : over -20
Type : Neutral
Timeframe : Daily
Pivot points : price is over resistance 3
Type : Neutral
Timeframe : Daily
Pivot points : price is over resistance 3
Type : Neutral
Timeframe : Weekly
RSI indicator is back over 50
Type : Bullish
Timeframe : Daily
Parabolic SAR indicator bullish reversal
Type : Bullish
Timeframe : Daily
SuperTrend indicator bullish reversal
Type : Bullish
Timeframe : Daily
Momentum indicator is back over 0
Type : Bullish
Timeframe : Daily
An analysis of the price chart with the Central Patterns scanner (detector of chart patterns and resistances and supports) shows several results that can have an impact on the price change:
Near horizontal resistance
Type : Bearish
Timeframe : Daily
Resistance of channel is broken
Type : Bullish
Timeframe : Daily
The Central Candlesticks scanner which studies Japanese candlesticks did not detect anything.
| S2 | S1 | Price | R1 | R2 | R3 | |
|---|---|---|---|---|---|---|
| ProTrendLines | 2.095 | 2.377 | 2.475 | 2.624 | 3.260 | 3.868 |
| Change (%) | -15.35% | -3.96% | - | +6.02% | +31.72% | +56.28% |
| Change | -0.380 | -0.098 | - | +0.149 | +0.785 | +1.393 |
| Level | Major | Minor | - | Minor | Minor | Intermediate |
To determine price objectives, it is also possible to use the pivot points. Here is the price position in relation to pivot points:
| Pivot points | S3 | S2 | S1 | PP | R1 | R2 | R3 |
|---|---|---|---|---|---|---|---|
| Standard | 2.100 | 2.175 | 2.325 | 2.400 | 2.550 | 2.625 | 2.775 |
| Camarilla | 2.413 | 2.434 | 2.454 | 2.475 | 2.496 | 2.516 | 2.537 |
| Woodie | 2.138 | 2.194 | 2.363 | 2.419 | 2.588 | 2.644 | 2.813 |
| Fibonacci | 2.175 | 2.261 | 2.314 | 2.400 | 2.486 | 2.539 | 2.625 |
| Pivot points | S3 | S2 | S1 | PP | R1 | R2 | R3 |
|---|---|---|---|---|---|---|---|
| Standard | 2.098 | 2.162 | 2.223 | 2.287 | 2.348 | 2.412 | 2.473 |
| Camarilla | 2.251 | 2.262 | 2.274 | 2.285 | 2.297 | 2.308 | 2.319 |
| Woodie | 2.098 | 2.161 | 2.223 | 2.286 | 2.348 | 2.411 | 2.473 |
| Fibonacci | 2.162 | 2.209 | 2.239 | 2.287 | 2.334 | 2.364 | 2.412 |
| Pivot points | S3 | S2 | S1 | PP | R1 | R2 | R3 |
|---|---|---|---|---|---|---|---|
| Standard | 1.690 | 1.895 | 2.065 | 2.270 | 2.440 | 2.645 | 2.815 |
| Camarilla | 2.132 | 2.166 | 2.201 | 2.235 | 2.269 | 2.304 | 2.338 |
| Woodie | 1.673 | 1.886 | 2.048 | 2.261 | 2.423 | 2.636 | 2.798 |
| Fibonacci | 1.895 | 2.038 | 2.127 | 2.270 | 2.413 | 2.502 | 2.645 |
Numerical data
The following are the details of the technical indicators and moving averages that were collected to generate this technical analysis:
| RSI (14): | 62.05 | |
| MACD (12,26,9): | -0.0130 | |
| Directional Movement: | 13.175 | |
| AROON (14): | 100.000 | |
| DEMA (21): | 2.262 | |
| Parabolic SAR (0,02-0,02-0,2): | 2.010 | |
| Elder Ray (13): | 0.073 | |
| Super Trend (3,10): | 2.104 | |
| Zig ZAG (10): | 2.475 | |
| VORTEX (21): | 0.9670 | |
| Stochastique (14,3,5): | 68.42 | |
| TEMA (21): | 2.318 | |
| Williams %R (14): | 0.00 | |
| Chande Momentum Oscillator (20): | 0.245 | |
| Repulse (5,40,3): | 11.6110 | |
| ROCnROLL: | -1 | |
| TRIX (15,9): | -0.1990 | |
| Courbe Coppock: | 2.44 |
| MA7: | 2.285 | |
| MA20: | 2.274 | |
| MA50: | 2.328 | |
| MA100: | 2.882 | |
| MAexp7: | 2.311 | |
| MAexp20: | 2.292 | |
| MAexp50: | 2.426 | |
| MAexp100: | 2.743 | |
| Price / MA7: | +8.32% | |
| Price / MA20: | +8.84% | |
| Price / MA50: | +6.31% | |
| Price / MA100: | -14.12% | |
| Price / MAexp7: | +7.10% | |
| Price / MAexp20: | +7.98% | |
| Price / MAexp50: | +2.02% | |
| Price / MAexp100: | -9.77% |
News
The last news published on UNIFIEDPOST GROUP at the time of the generation of this analysis was as follows:
- Unifiedpost Group reports strong Q3 2023 performance and strategic progress
- Unifiedpost grows digital revenue while further improving operational efficiency
- Interim condensed consolidated financial statements for the six-month period ended 30 June 2023
- Unifiedpost Group Announces divestment of the stand-alone products FitekIN and ONEA
- Unifiedpost takes the lead in building a compliant network for businesses
About author
Online


Add a comment
Comments
0 comments on the analysis UNIFIEDPOST GROUP - Daily