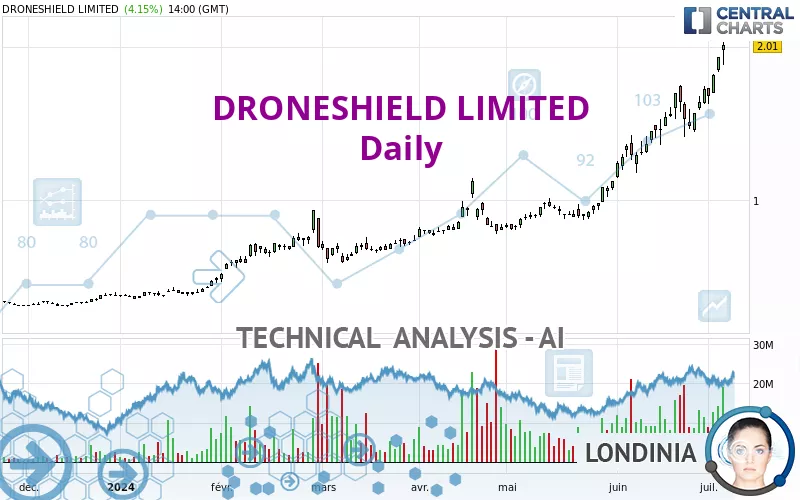
DRONESHIELD LIMITED - Daily - Technical analysis published on 07/05/2024 (GMT)
- 183
- 0
Click here for a new analysis!
- Timeframe : Daily
- - Analysis generated on
- Status : TARGET REACHED
Summary of the analysis

Additional analysis
Quotes
DRONESHIELD LIMITED rating 2.010 AUD. On the day, this instrument gained +4.15% and was traded between 1.880 AUD and 2.030 AUD over the period. The price is currently at +6.91% from its lowest and -0.99% from its highest.The Central Gaps scanner detects the formation of a bullish gap marking the strong presence of buyers against sellers at the opening. This formed a quotation gap.
Opening Gap UP
Type : Bullish
Timeframe : Openning
Here is a more detailed summary of the historical variations registered by DRONESHIELD LIMITED:
New HIGH record (5 years)
Type : Bullish
Timeframe : Weekly
New HIGH record (1 year)
Type : Bullish
Timeframe : Weekly
New HIGH record (1st january)
Type : Bullish
Timeframe : Weekly
New HIGH record (1 month)
Type : Bullish
Timeframe : Weekly
The Central Volumes scanner notes the presence of abnormal volumes:
Abnormal volumes
Timeframe : 5 days
Abnormal volumes
Timeframe : 20 days
Abnormal volumes
Timeframe : 50 days
Technical
Technical analysis of this Daily chart of DRONESHIELD LIMITED indicates that the overall trend is strongly bullish. The signals given by the moving averages are 92.86% bullish. This strong bullish trend is confirmed by the strong signals currently being given by short-term moving averages. The Central Indicators scanner does not detect any result on moving averages that would impact this trend.
In fact, 16 technical indicators on 18 studied are currently bullish. Caution: the Central Indicators scanner currently detects an excess:
RSI indicator is overbought : over 70
Type : Neutral
Timeframe : Daily
CCI indicator is overbought : over 100
Type : Neutral
Timeframe : Daily
Williams %R indicator is overbought : over -20
Type : Neutral
Timeframe : Daily
Pivot points : price is over resistance 2
Type : Neutral
Timeframe : Daily
Pivot points : price is over resistance 2
Type : Neutral
Timeframe : Weekly
The analysis of the price chart with Central Patterns scanners does not return any result.
The Central Candlesticks scanner, specialised in Japanese candlesticks, did not identify any signals.
| S3 | S2 | S1 | Price | |
|---|---|---|---|---|
| ProTrendLines | 0.930 | 1.120 | 1.700 | 2.010 |
| Change (%) | -53.73% | -44.28% | -15.42% | - |
| Change | -1.080 | -0.890 | -0.310 | - |
| Level | Minor | Major | Minor | - |
To determine price objectives, it is also possible to use the pivot points. Here is the price position in relation to pivot points:
| Pivot points | S3 | S2 | S1 | PP | R1 | R2 | R3 |
|---|---|---|---|---|---|---|---|
| Standard | 1.767 | 1.824 | 1.916 | 1.973 | 2.065 | 2.122 | 2.214 |
| Camarilla | 1.968 | 1.982 | 1.995 | 2.009 | 2.023 | 2.036 | 2.050 |
| Woodie | 1.786 | 1.833 | 1.935 | 1.982 | 2.084 | 2.131 | 2.233 |
| Fibonacci | 1.824 | 1.881 | 1.916 | 1.973 | 2.030 | 2.065 | 2.122 |
| Pivot points | S3 | S2 | S1 | PP | R1 | R2 | R3 |
|---|---|---|---|---|---|---|---|
| Standard | 1.177 | 1.293 | 1.507 | 1.623 | 1.837 | 1.953 | 2.167 |
| Camarilla | 1.629 | 1.660 | 1.690 | 1.720 | 1.750 | 1.781 | 1.811 |
| Woodie | 1.225 | 1.318 | 1.555 | 1.648 | 1.885 | 1.978 | 2.215 |
| Fibonacci | 1.293 | 1.419 | 1.497 | 1.623 | 1.749 | 1.827 | 1.953 |
| Pivot points | S3 | S2 | S1 | PP | R1 | R2 | R3 |
|---|---|---|---|---|---|---|---|
| Standard | 0.722 | 0.933 | 1.327 | 1.538 | 1.932 | 2.143 | 2.537 |
| Camarilla | 1.554 | 1.609 | 1.665 | 1.720 | 1.776 | 1.831 | 1.886 |
| Woodie | 0.813 | 0.979 | 1.418 | 1.584 | 2.023 | 2.189 | 2.628 |
| Fibonacci | 0.933 | 1.164 | 1.307 | 1.538 | 1.769 | 1.912 | 2.143 |
Numerical data
The following are the details of the technical indicators and moving averages that were collected to generate this technical analysis:
| RSI (14): | 79.70 | |
| MACD (12,26,9): | 0.1950 | |
| Directional Movement: | 34.507 | |
| AROON (14): | 92.857 | |
| DEMA (21): | 1.835 | |
| Parabolic SAR (0,02-0,02-0,2): | 1.468 | |
| Elder Ray (13): | 0.264 | |
| Super Trend (3,10): | 1.585 | |
| Zig ZAG (10): | 2.009 | |
| VORTEX (21): | 1.2250 | |
| Stochastique (14,3,5): | 98.86 | |
| TEMA (21): | 1.904 | |
| Williams %R (14): | -2.99 | |
| Chande Momentum Oscillator (20): | 0.469 | |
| Repulse (5,40,3): | 14.0210 | |
| ROCnROLL: | 1 | |
| TRIX (15,9): | 1.9640 | |
| Courbe Coppock: | 52.45 |
| MA7: | 1.766 | |
| MA20: | 1.571 | |
| MA50: | 1.200 | |
| MA100: | 0.971 | |
| MAexp7: | 1.803 | |
| MAexp20: | 1.587 | |
| MAexp50: | 1.300 | |
| MAexp100: | 1.046 | |
| Price / MA7: | +13.82% | |
| Price / MA20: | +27.94% | |
| Price / MA50: | +67.50% | |
| Price / MA100: | +107.00% | |
| Price / MAexp7: | +11.48% | |
| Price / MAexp20: | +26.65% | |
| Price / MAexp50: | +54.62% | |
| Price / MAexp100: | +92.16% |
News
Don't forget to follow the news on DRONESHIELD LIMITED. At the time of publication of this analysis, the latest news was as follows:
- DroneShield Awarded Record $33 Million U.S. Government Contract
- DroneShield receives a record $9.9 million DoD Contract
- DroneShield Completes $40 million Capital Raise with Substantial Investor Support
- DroneShield Completes $40 million Capital Raise with Substantial Investor Support
- DroneShield Announces A Second $11 million Sale, Strong Momentum into 2023
About author

Online


Add a comment
Comments
0 comments on the analysis DRONESHIELD LIMITED - Daily