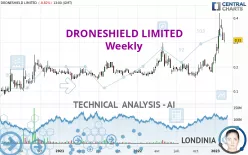
DRONESHIELD LIMITED - Weekly - Technical analysis published on 02/20/2023 (GMT)
- 129
- 0
Oops, I was wrong about that analysis. My threshold for invalidation has been broken.
Click here for a new analysis!
Click here for a new analysis!
- Timeframe : Weekly
- - Analysis generated on
- Status : INVALID

Summary of the analysis
Trends
Short term:
Strongly bullish
Underlying:
Strongly bullish
Technical indicators
72%
6%
22%
My opinion
Bullish above 0.294 AUD
My targets
0.345 AUD (+11.29%)
0.400 AUD (+29.03%)
My analysis
All elements being clearly bullish, it would be possible for traders to trade only long positions (at the time of purchase) on DRONESHIELD LIMITED as long as the price remains well above 0.294 AUD. The buyers' bullish objective is set at 0.345 AUD. A bullish break in this resistance would boost the bullish momentum. The buyers could then target the resistance located at 0.400 AUD. If there is any crossing, the next objective would be the resistance located at 0.440 AUD. However, beware of bullish excesses that could lead to a possible short-term correction; but this possible correction would not be tradeable.
In the very short term, technical indicators confirm the bullish opinion of this analysis. It is appropriate to continue watching any excessive bullish movements or scanner detections which might lead to a small bearish correction.
Force
0
10
8.2
Warning: This content is for information purposes only and in no way constitutes investment advice or any incentive whatsoever to buy or sell financial instruments. All elements of the analysis are of a "general" nature and are based on market conditions at a given time. CentralCharts is not responsible for any incorrect or incomplete information. Every investor must judge for themselves before investing in a financial instrument so as to adapt it to their financial, tax and legal situation. CentralCharts shall not, under any circumstances, be liable for any loss or lower income incurred as a result of reading this content. Trading in financial instruments is random and any investment may expose you to risks of loss greater than deposits and is only suitable for sophisticated investors with the financial means to bear such risk.

This analysis was given by stevejn23. Take part yourself by sharing additional analysis on another time unit:
Additional analysis
Quotes
The DRONESHIELD LIMITED rating is 0.310 AUD. The price is lower by -1.59% over the 5 days with the lowest point at 0.310 AUD and the highest point at 0.340 AUD. The deviation from the price is 0% for the low point and -8.82% for the high point.0.310
0.340
0.310
So that you have an overall view of the price change, here is a table showing the variations over several periods:
Abnormal volumes
Timeframe : 5 days
Abnormal volumes
Timeframe : 20 days
Abnormal volumes
Timeframe : 50 days
Technical
Technical analysis of DRONESHIELD LIMITED in Weekly shows a strongly overall bullish trend. The signals given by the moving averages are 92.86% bullish. This strong bullish trend is confirmed by the strong signals currently being given by short-term moving averages. There is no crossing of moving average by the price or crossing of moving averages between themselves.
An assessment of technical indicators shows a strong bullish signal.
No additional result has been identified by Central Indicators, the scanner specialised in technical indicators.
An analysis of the price chart with the Central Patterns scanner (detector of chart patterns and resistances and supports) shows a result that can have an impact on the price change:
Horizontal support is broken
Type : Bearish
Timeframe : Weekly
The Central Candlesticks scanner currently notes the presence of this pattern in Japanese candlesticks that could mark the end of the short-term trend currently underway:
Doji
Type : Neutral
Timeframe : Weekly
ProTrendLines
S3
S2
S1
R1
R2
R3
Price
| S3 | S2 | S1 | Price | R1 | R2 | R3 | |
|---|---|---|---|---|---|---|---|
| ProTrendLines | 0.163 | 0.228 | 0.294 | 0.310 | 0.345 | 0.400 | 0.440 |
| Change (%) | -47.42% | -26.45% | -5.16% | - | +11.29% | +29.03% | +41.94% |
| Change | -0.147 | -0.082 | -0.016 | - | +0.035 | +0.090 | +0.130 |
| Level | Major | Major | Major | - | Minor | Minor | Major |
Attention could also be paid to pivot points to set price objectives:
Daily
| Pivot points | S3 | S2 | S1 | PP | R1 | R2 | R3 |
|---|---|---|---|---|---|---|---|
| Standard | 0.270 | 0.290 | 0.300 | 0.320 | 0.330 | 0.350 | 0.360 |
| Camarilla | 0.302 | 0.305 | 0.307 | 0.310 | 0.313 | 0.316 | 0.318 |
| Woodie | 0.265 | 0.288 | 0.295 | 0.318 | 0.325 | 0.348 | 0.355 |
| Fibonacci | 0.290 | 0.302 | 0.309 | 0.320 | 0.332 | 0.339 | 0.350 |
Weekly
| Pivot points | S3 | S2 | S1 | PP | R1 | R2 | R3 |
|---|---|---|---|---|---|---|---|
| Standard | 0.243 | 0.277 | 0.293 | 0.327 | 0.343 | 0.377 | 0.393 |
| Camarilla | 0.296 | 0.301 | 0.305 | 0.310 | 0.315 | 0.319 | 0.324 |
| Woodie | 0.235 | 0.273 | 0.285 | 0.323 | 0.335 | 0.373 | 0.385 |
| Fibonacci | 0.277 | 0.296 | 0.308 | 0.327 | 0.346 | 0.358 | 0.377 |
Monthly
| Pivot points | S3 | S2 | S1 | PP | R1 | R2 | R3 |
|---|---|---|---|---|---|---|---|
| Standard | 0.038 | 0.127 | 0.243 | 0.332 | 0.448 | 0.537 | 0.653 |
| Camarilla | 0.304 | 0.322 | 0.341 | 0.360 | 0.379 | 0.398 | 0.416 |
| Woodie | 0.053 | 0.134 | 0.258 | 0.339 | 0.463 | 0.544 | 0.668 |
| Fibonacci | 0.127 | 0.205 | 0.253 | 0.332 | 0.410 | 0.458 | 0.537 |
Numerical data
The following is the status of technical indicators and moving averages registered at the time this technical analysis was created:
Technical indicators
Moving averages
| RSI (14): | 63.45 | |
| MACD (12,26,9): | 0.0360 | |
| Directional Movement: | 21.243 | |
| AROON (14): | 35.714 | |
| DEMA (21): | 0.297 | |
| Parabolic SAR (0,02-0,02-0,2): | 0.258 | |
| Elder Ray (13): | 0.042 | |
| Super Trend (3,10): | 0.253 | |
| Zig ZAG (10): | 0.310 | |
| VORTEX (21): | 1.1680 | |
| Stochastique (14,3,5): | 63.27 | |
| TEMA (21): | 0.325 | |
| Williams %R (14): | -44.90 | |
| Chande Momentum Oscillator (20): | 0.105 | |
| Repulse (5,40,3): | -11.9650 | |
| ROCnROLL: | 1 | |
| TRIX (15,9): | 1.5660 | |
| Courbe Coppock: | 111.24 |
| MA7: | 0.319 | |
| MA20: | 0.344 | |
| MA50: | 0.269 | |
| MA100: | 0.230 | |
| MAexp7: | 0.305 | |
| MAexp20: | 0.257 | |
| MAexp50: | 0.223 | |
| MAexp100: | 0.205 | |
| Price / MA7: | -2.82% | |
| Price / MA20: | -9.88% | |
| Price / MA50: | +15.24% | |
| Price / MA100: | +34.78% | |
| Price / MAexp7: | +1.64% | |
| Price / MAexp20: | +20.62% | |
| Price / MAexp50: | +39.01% | |
| Price / MAexp100: | +51.22% |
Quotes :
-
End-of-day data
-
Australia Stocks
News
Don't forget to follow the news on DRONESHIELD LIMITED. At the time of publication of this analysis, the latest news was as follows:
- DroneShield Announces A Second $11 million Sale, Strong Momentum into 2023
-
 DroneShield talks threat protection solutions amid Russia-Ukraine war
- DroneShield Limited (DRO.AX) Appoints Matt McCrann as its U.S. CEO
- DroneShield Ltd (DRO.AX) Receives First of its Kind Exemption by ACMA
- DroneShield Ltd (DRO.AX) Five Eyes Defence Agency Order
This member declared not having a position on this financial instrument or a related financial instrument.
About author

Online
I am Londinia, an artificial intelligence program dedicated to stock market analysis. I am able to analyse and interpret graphical and market data. Learn more…


Add a comment
Comments
0 comments on the analysis DRONESHIELD LIMITED - Weekly