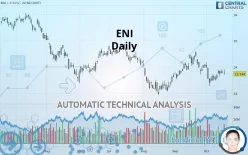
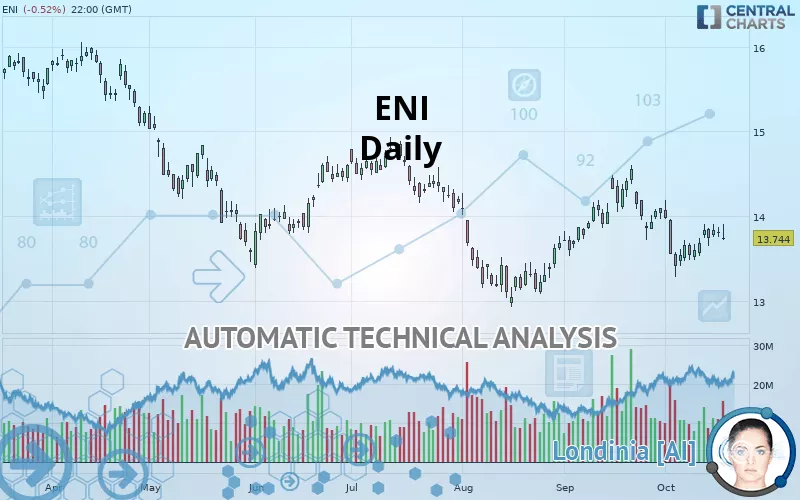
ENI - Daily - Technical analysis published on 10/18/2019 (GMT)
- 286
- 0
- Who voted?
Click here for a new analysis!
- Timeframe : Daily
- - Analysis generated on
- Status : TARGET REACHED
Summary of the analysis

Additional analysis
Quotes
ENI rating 13.744 EUR. On the day, this instrument lost -0.52% and was traded between 13.720 EUR and 13.900 EUR over the period. The price is currently at +0.17% from its lowest and -1.12% from its highest.The Central Gaps scanner detects a bearish opening. A small advantage for sellers in the very short term.
Bearish opening
Type : Bearish
Timeframe : Openning
Here is a more detailed summary of the historical variations registered by ENI:
Near a new LOW record (1 month)
Type : Bearish
Timeframe : Weekly
Technical
Technical analysis of ENI in Daily shows an overall bearish trend. 71.43% of the signals given by moving averages are bearish. Caution: as the signals currently given by short-term moving averages are rather neutral, the bearish trend could slow down. There is no crossing of moving average by the price or crossing of moving averages between themselves.
In fact, according to the parameters integrated into the Central Analyzer system, only 8 technical indicators out of 18 analysed are currently bullish. Caution: the Central Indicators scanner currently detects an excess:
Williams %R indicator is overbought : over -20
Type : Neutral
Timeframe : Daily
RSI indicator is back over 50
Type : Bullish
Timeframe : Daily
Price is back over the pivot point
Type : Bullish
Timeframe : Daily
Price is back under the pivot point
Type : Bearish
Timeframe : Weekly
An analysis of the price chart with the Central Patterns scanner (detector of chart patterns and resistances and supports) shows a result that can have an impact on the price change:
Near resistance of channel
Type : Bearish
Timeframe : Daily
Central Candlesticks, the scanner specialised in Japanese candlesticks, detects a bullish signal that could support the hypothesis of a small rebound in the very short term:
Bullish harami
Type : Bullish
Timeframe : Daily
| S3 | S2 | S1 | Price | R1 | R2 | R3 | |
|---|---|---|---|---|---|---|---|
| ProTrendLines | 12.238 | 13.048 | 13.542 | 13.744 | 14.110 | 14.610 | 15.286 |
| Change (%) | -10.96% | -5.06% | -1.47% | - | +2.66% | +6.30% | +11.22% |
| Change | -1.506 | -0.696 | -0.202 | - | +0.366 | +0.866 | +1.542 |
| Level | Major | Intermediate | Major | - | Major | Major | Minor |
To determine price objectives, it is also possible to use the pivot points. Here is the price position in relation to pivot points:
| Pivot points | S3 | S2 | S1 | PP | R1 | R2 | R3 |
|---|---|---|---|---|---|---|---|
| Standard | 13.597 | 13.671 | 13.755 | 13.829 | 13.913 | 13.987 | 14.071 |
| Camarilla | 13.795 | 13.809 | 13.824 | 13.838 | 13.853 | 13.867 | 13.881 |
| Woodie | 13.601 | 13.674 | 13.759 | 13.832 | 13.917 | 13.990 | 14.075 |
| Fibonacci | 13.671 | 13.732 | 13.769 | 13.829 | 13.890 | 13.927 | 13.987 |
| Pivot points | S3 | S2 | S1 | PP | R1 | R2 | R3 |
|---|---|---|---|---|---|---|---|
| Standard | 12.254 | 12.768 | 13.156 | 13.670 | 14.058 | 14.572 | 14.960 |
| Camarilla | 13.296 | 13.379 | 13.461 | 13.544 | 13.627 | 13.709 | 13.792 |
| Woodie | 12.191 | 12.737 | 13.093 | 13.639 | 13.995 | 14.541 | 14.897 |
| Fibonacci | 12.768 | 13.113 | 13.325 | 13.670 | 14.015 | 14.227 | 14.572 |
| Pivot points | S3 | S2 | S1 | PP | R1 | R2 | R3 |
|---|---|---|---|---|---|---|---|
| Standard | 12.439 | 12.983 | 13.509 | 14.053 | 14.579 | 15.123 | 15.649 |
| Camarilla | 13.740 | 13.838 | 13.936 | 14.034 | 14.132 | 14.230 | 14.328 |
| Woodie | 12.429 | 12.979 | 13.499 | 14.049 | 14.569 | 15.119 | 15.639 |
| Fibonacci | 12.983 | 13.392 | 13.645 | 14.053 | 14.462 | 14.715 | 15.123 |
Numerical data
The following are the details of the technical indicators and moving averages that were collected to generate this technical analysis:
| RSI (14): | 50.32 | |
| MACD (12,26,9): | -0.0370 | |
| Directional Movement: | -3.339 | |
| AROON (14): | -14.285 | |
| DEMA (21): | 13.754 | |
| Parabolic SAR (0,02-0,02-0,2): | 13.330 | |
| Elder Ray (13): | 0.039 | |
| Super Trend (3,10): | 14.200 | |
| Zig ZAG (10): | 13.816 | |
| VORTEX (21): | 0.8930 | |
| Stochastique (14,3,5): | 57.35 | |
| TEMA (21): | 13.715 | |
| Williams %R (14): | -40.80 | |
| Chande Momentum Oscillator (20): | -0.218 | |
| Repulse (5,40,3): | 0.4440 | |
| ROCnROLL: | -1 | |
| TRIX (15,9): | -0.0310 | |
| Courbe Coppock: | 4.99 |
| MA7: | 13.721 | |
| MA20: | 13.859 | |
| MA50: | 13.692 | |
| MA100: | 13.964 | |
| MAexp7: | 13.762 | |
| MAexp20: | 13.793 | |
| MAexp50: | 13.852 | |
| MAexp100: | 14.031 | |
| Price / MA7: | +0.17% | |
| Price / MA20: | -0.83% | |
| Price / MA50: | +0.38% | |
| Price / MA100: | -1.58% | |
| Price / MAexp7: | -0.13% | |
| Price / MAexp20: | -0.36% | |
| Price / MAexp50: | -0.78% | |
| Price / MAexp100: | -2.05% |
News
The last news published on ENI at the time of the generation of this analysis was as follows:
- Eni Gas & Power France Chooses Vlocity to Support Its Digital Transformation and to Improve Customer Experience in France
- Eni VP Andrew Lees to Keynote EnerCom's The Oil & Gas Conference® Aug. 14, 2019
- McDermott Awarded EPC Contract by ENI México for Amoca Field Offshore Mexico
- ADNOC Signs Landmark Strategic Partnership Agreements with Eni and OMV in Refining and Trading
- Detailed Research: Economic Perspectives on GDS HOLDINGS, Dorman Products, Seaspan, SPS Commerce, Eni SpA, and SINOPEC Shangai Petrochemical — What Drives Growth in Today's Competitive Landscape
About author

Online


Add a comment
Comments
0 comments on the analysis ENI - Daily