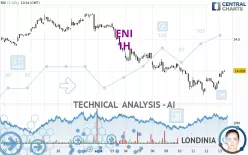
ENI - 1H - Technical analysis published on 09/13/2024 (GMT)
- 145
- 0
Click here for a new analysis!
- Timeframe : 1H
- - Analysis generated on
- Status : TARGET REACHED

Summary of the analysis

Additional analysis
Quotes
The ENI rating is 14.008 EUR. The price registered an increase of +1.14% on the session with the lowest point at 13.912 EUR and the highest point at 14.020 EUR. The deviation from the price is +0.69% for the low point and -0.09% for the high point.The Central Gaps scanner detects the formation of a bullish gap marking the strong presence of buyers against sellers at the opening. This formed a quotation gap.
Opening Gap UP
Type : Bullish
Timeframe : Openning
Here is a more detailed summary of the historical variations registered by ENI:
Near a new LOW record (1 year)
Type : Bearish
Timeframe : Weekly
Near a new LOW record (1st january)
Type : Bearish
Timeframe : Weekly
Near a new LOW record (1 month)
Type : Bearish
Timeframe : Weekly
Technical
A technical analysis in 1H of this ENI chart shows a slightly bearish trend. 57.14% of the signals given by moving averages are bearish. Caution: the strong bullish signals currently being given by short-term moving averages indicate that this slightly bearish trend could quickly be reversed. The Central Indicators scanner detects bullish signals on moving averages that could impact this trend:
Bullish trend reversal : adaptative moving average 50
Type : Bullish
Timeframe : 1 hour
Bullish price crossover with adaptative moving average 100
Type : Bullish
Timeframe : 1 hour
In fact, according to the parameters integrated into the Central Analyzer system, 15 technical indicators out of 18 analysed are currently bullish. But beware of excesses. The Central Indicators scanner currently detects this:
CCI indicator is overbought : over 100
Type : Neutral
Timeframe : 1 hour
Williams %R indicator is overbought : over -20
Type : Neutral
Timeframe : 1 hour
Pivot points : price is over resistance 1
Type : Neutral
Timeframe : 1 hour
MACD indicator is back over 0
Type : Bullish
Timeframe : 1 hour
The Central Patterns scanner, which studies chart patterns, resistances and supports, has identified these signals:
Near horizontal resistance
Type : Bearish
Timeframe : 1 hour
Resistance of channel is broken
Type : Bullish
Timeframe : 1 hour
No result was found by the Central Candlesticks scanner on Japanese candlesticks.
| S3 | S2 | S1 | Price | R1 | R2 | R3 | |
|---|---|---|---|---|---|---|---|
| ProTrendLines | 13.472 | 13.682 | 13.924 | 14.008 | 14.133 | 14.464 | 14.673 |
| Change (%) | -3.83% | -2.33% | -0.60% | - | +0.89% | +3.26% | +4.75% |
| Change | -0.536 | -0.326 | -0.084 | - | +0.125 | +0.456 | +0.665 |
| Level | Major | Major | Major | - | Minor | Intermediate | Intermediate |
To determine price objectives, it is also possible to use the pivot points. Here is the price position in relation to pivot points:
| Pivot points | S3 | S2 | S1 | PP | R1 | R2 | R3 |
|---|---|---|---|---|---|---|---|
| Standard | 13.525 | 13.615 | 13.733 | 13.823 | 13.941 | 14.031 | 14.149 |
| Camarilla | 13.793 | 13.812 | 13.831 | 13.850 | 13.869 | 13.888 | 13.907 |
| Woodie | 13.538 | 13.622 | 13.746 | 13.830 | 13.954 | 14.038 | 14.162 |
| Fibonacci | 13.615 | 13.695 | 13.744 | 13.823 | 13.903 | 13.952 | 14.031 |
| Pivot points | S3 | S2 | S1 | PP | R1 | R2 | R3 |
|---|---|---|---|---|---|---|---|
| Standard | 12.949 | 13.465 | 13.727 | 14.243 | 14.505 | 15.021 | 15.283 |
| Camarilla | 13.774 | 13.845 | 13.917 | 13.988 | 14.059 | 14.131 | 14.202 |
| Woodie | 12.821 | 13.402 | 13.599 | 14.180 | 14.377 | 14.958 | 15.155 |
| Fibonacci | 13.465 | 13.763 | 13.946 | 14.243 | 14.541 | 14.724 | 15.021 |
| Pivot points | S3 | S2 | S1 | PP | R1 | R2 | R3 |
|---|---|---|---|---|---|---|---|
| Standard | 12.739 | 13.219 | 13.947 | 14.427 | 15.155 | 15.635 | 16.363 |
| Camarilla | 14.342 | 14.453 | 14.563 | 14.674 | 14.785 | 14.896 | 15.006 |
| Woodie | 12.862 | 13.281 | 14.070 | 14.489 | 15.278 | 15.697 | 16.486 |
| Fibonacci | 13.219 | 13.681 | 13.966 | 14.427 | 14.889 | 15.174 | 15.635 |
Numerical data
The following is the status of technical indicators and moving averages registered at the time this technical analysis was created:
| RSI (14): | 59.80 | |
| MACD (12,26,9): | 0.0020 | |
| Directional Movement: | 8.447 | |
| AROON (14): | 92.857 | |
| DEMA (21): | 13.866 | |
| Parabolic SAR (0,02-0,02-0,2): | 13.730 | |
| Elder Ray (13): | 0.107 | |
| Super Trend (3,10): | 13.787 | |
| Zig ZAG (10): | 14.006 | |
| VORTEX (21): | 1.0380 | |
| Stochastique (14,3,5): | 95.33 | |
| TEMA (21): | 13.930 | |
| Williams %R (14): | -0.61 | |
| Chande Momentum Oscillator (20): | 0.158 | |
| Repulse (5,40,3): | 0.4160 | |
| ROCnROLL: | -1 | |
| TRIX (15,9): | -0.0350 | |
| Courbe Coppock: | 1.76 |
| MA7: | 13.946 | |
| MA20: | 14.351 | |
| MA50: | 14.302 | |
| MA100: | 14.353 | |
| MAexp7: | 13.928 | |
| MAexp20: | 13.883 | |
| MAexp50: | 13.973 | |
| MAexp100: | 14.130 | |
| Price / MA7: | +0.44% | |
| Price / MA20: | -2.39% | |
| Price / MA50: | -2.06% | |
| Price / MA100: | -2.40% | |
| Price / MAexp7: | +0.57% | |
| Price / MAexp20: | +0.90% | |
| Price / MAexp50: | +0.25% | |
| Price / MAexp100: | -0.86% |
News
Don't forget to follow the news on ENI. At the time of publication of this analysis, the latest news was as follows:
- Eni Sustainable Mobility and PBF Energy Announce Closing of St. Bernard Biorefinery Partnership
- Eni Sustainable Mobility and PBF Energy Announce Partnership for St. Bernard Biorefinery in the US
-
 Giorgia Meloni visits Tripoli as Libya signs $8bn gas exploration deal with Eni
- NFE and Eni Congo Agree to Deploy Fast LNG Solution in The Republic of Congo
- KNOT Awarded Long-Term Charters With ENI For Two New Shuttle Tankers With LNG Propulsion System
About author
Online


Add a comment
Comments
0 comments on the analysis ENI - 1H