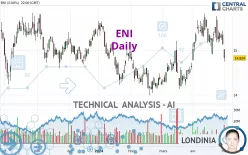
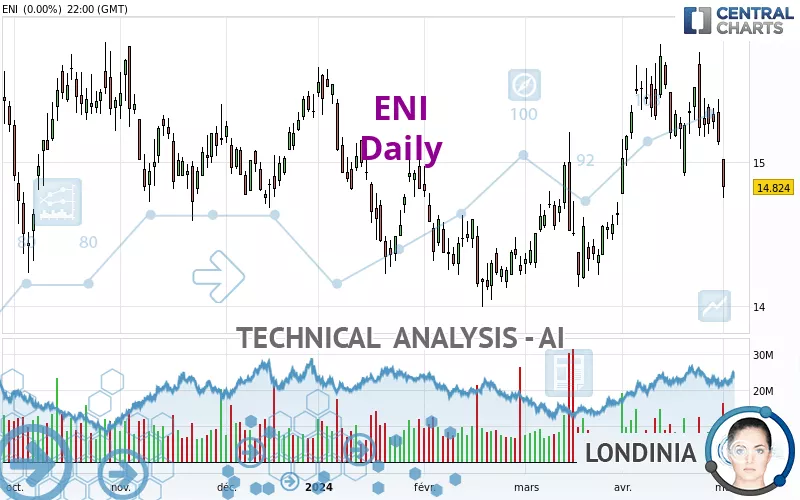
ENI - Daily - Technical analysis published on 05/03/2024 (GMT)
- 143
- 0
- Timeframe : Daily
- - Analysis generated on
- Status : NEUTRAL
Summary of the analysis

Additional analysis
Quotes
ENI rating 14.770 EUR. The price registered a decrease of -0.36% on the session and was traded between 14.730 EUR and 14.854 EUR over the period. The price is currently at +0.27% from its lowest and -0.57% from its highest.A bullish opening was detected by the Central Gaps scanner. Buyers are trying to impose a bullish momentum in the very short term.
Bullish opening
Type : Bullish
Timeframe : Openning
So that you have an overall view of the price change, here is a table showing the variations over several periods:
Near a new HIGH record (5 years)
Type : Bullish
Timeframe : Weekly
New LOW record (1 month)
Type : Bearish
Timeframe : Weekly
Technical
Technical analysis of ENI in Daily shows an overall slightly bullish trend. Only 60.71% of the signals given by moving averages are bullish. This slightly bullish trend could turn neutral or reverse given the slightly bearish signals currently being given by short-term moving averages. The Central Indicators market scanner is currently detecting several bearish signals that could impact this trend:
Bearish trend reversal : Moving Average 20
Type : Bearish
Timeframe : Daily
Bearish trend reversal : adaptative moving average 50
Type : Bearish
Timeframe : Daily
Bearish price crossover with adaptative moving average 100
Type : Bearish
Timeframe : Daily
In fact, 12 technical indicators on 18 studied are currently positioned bearish. Caution: the Central Indicators scanner currently detects an excess:
CCI indicator is oversold : under -100
Type : Neutral
Timeframe : Daily
Previous candle closed under Bollinger bands
Type : Neutral
Timeframe : Daily
Williams %R indicator is oversold : under -80
Type : Neutral
Timeframe : Daily
Pivot points : price is under support 3
Type : Neutral
Timeframe : Weekly
SuperTrend indicator bearish reversal
Type : Bearish
Timeframe : Daily
The Central Patterns scanner, which studies chart patterns, resistances and supports, has identified these signals:
Near horizontal support
Type : Bullish
Timeframe : Daily
Near support of triangle
Type : Bullish
Timeframe : Daily
Support of channel is broken
Type : Bearish
Timeframe : Daily
The Central Candlesticks scanner which studies Japanese candlesticks did not detect anything.
| S3 | S2 | S1 | Price | R1 | R2 | |
|---|---|---|---|---|---|---|
| ProTrendLines | 13.908 | 14.359 | 14.736 | 14.770 | 15.299 | 15.730 |
| Change (%) | -5.84% | -2.78% | -0.23% | - | +3.58% | +6.50% |
| Change | -0.862 | -0.411 | -0.034 | - | +0.529 | +0.960 |
| Level | Major | Intermediate | Intermediate | - | Major | Minor |
Pivot points can also be used to set your price objectives. Here is the price situation in relation to pivot points:
| Pivot points | S3 | S2 | S1 | PP | R1 | R2 | R3 |
|---|---|---|---|---|---|---|---|
| Standard | 14.436 | 14.592 | 14.708 | 14.864 | 14.980 | 15.136 | 15.252 |
| Camarilla | 14.749 | 14.774 | 14.799 | 14.824 | 14.849 | 14.874 | 14.899 |
| Woodie | 14.416 | 14.582 | 14.688 | 14.854 | 14.960 | 15.126 | 15.232 |
| Fibonacci | 14.592 | 14.696 | 14.760 | 14.864 | 14.968 | 15.032 | 15.136 |
| Pivot points | S3 | S2 | S1 | PP | R1 | R2 | R3 |
|---|---|---|---|---|---|---|---|
| Standard | 14.450 | 14.812 | 15.036 | 15.398 | 15.622 | 15.984 | 16.208 |
| Camarilla | 15.099 | 15.153 | 15.206 | 15.260 | 15.314 | 15.367 | 15.421 |
| Woodie | 14.381 | 14.778 | 14.967 | 15.364 | 15.553 | 15.950 | 16.139 |
| Fibonacci | 14.812 | 15.036 | 15.174 | 15.398 | 15.622 | 15.760 | 15.984 |
| Pivot points | S3 | S2 | S1 | PP | R1 | R2 | R3 |
|---|---|---|---|---|---|---|---|
| Standard | 13.636 | 14.208 | 14.672 | 15.244 | 15.708 | 16.280 | 16.744 |
| Camarilla | 14.851 | 14.946 | 15.041 | 15.136 | 15.231 | 15.326 | 15.421 |
| Woodie | 13.582 | 14.181 | 14.618 | 15.217 | 15.654 | 16.253 | 16.690 |
| Fibonacci | 14.208 | 14.604 | 14.848 | 15.244 | 15.640 | 15.884 | 16.280 |
Numerical data
The following are the details of the technical indicators and moving averages that were collected to generate this technical analysis:
| RSI (14): | 40.82 | |
| MACD (12,26,9): | 0.0460 | |
| Directional Movement: | -2.545 | |
| AROON (14): | -100.000 | |
| DEMA (21): | 15.242 | |
| Parabolic SAR (0,02-0,02-0,2): | 15.740 | |
| Elder Ray (13): | -0.342 | |
| Super Trend (3,10): | 15.619 | |
| Zig ZAG (10): | 14.760 | |
| VORTEX (21): | 0.9200 | |
| Stochastique (14,3,5): | 11.74 | |
| TEMA (21): | 15.120 | |
| Williams %R (14): | -97.48 | |
| Chande Momentum Oscillator (20): | -0.446 | |
| Repulse (5,40,3): | -3.2420 | |
| ROCnROLL: | 2 | |
| TRIX (15,9): | 0.1580 | |
| Courbe Coppock: | 4.22 |
| MA7: | 15.106 | |
| MA20: | 15.302 | |
| MA50: | 14.758 | |
| MA100: | 14.662 | |
| MAexp7: | 15.050 | |
| MAexp20: | 15.124 | |
| MAexp50: | 14.910 | |
| MAexp100: | 14.693 | |
| Price / MA7: | -2.22% | |
| Price / MA20: | -3.48% | |
| Price / MA50: | +0.08% | |
| Price / MA100: | +0.74% | |
| Price / MAexp7: | -1.86% | |
| Price / MAexp20: | -2.34% | |
| Price / MAexp50: | -0.94% | |
| Price / MAexp100: | +0.52% |
News
The last news published on ENI at the time of the generation of this analysis was as follows:
- Eni Sustainable Mobility and PBF Energy Announce Closing of St. Bernard Biorefinery Partnership
- Eni Sustainable Mobility and PBF Energy Announce Partnership for St. Bernard Biorefinery in the US
-
 Giorgia Meloni visits Tripoli as Libya signs $8bn gas exploration deal with Eni
- NFE and Eni Congo Agree to Deploy Fast LNG Solution in The Republic of Congo
- KNOT Awarded Long-Term Charters With ENI For Two New Shuttle Tankers With LNG Propulsion System
About author
Online


Add a comment
Comments
0 comments on the analysis ENI - Daily