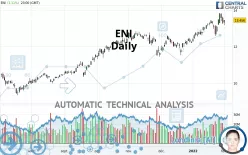
ENI - Daily - Technical analysis published on 02/02/2022 (GMT)
- 259
- 0
Click here for a new analysis!
- Timeframe : Daily
- - Analysis generated on
- Status : LEVEL MAINTAINED

Summary of the analysis

Additional analysis
Quotes
ENI rating 13.456 EUR. On the day, this instrument gained +1.11% and was traded between 13.180 EUR and 13.456 EUR over the period. The price is currently at +2.09% from its lowest and 0% from its highest.A bullish opening was detected by the Central Gaps scanner. Buyers are trying to impose a bullish momentum in the very short term.
Bullish opening
Type : Bullish
Timeframe : Openning
So that you have an overall view of the price change, here is a table showing the variations over several periods:
Near a new HIGH record (5 years)
Type : Bullish
Timeframe : Weekly
Near a new HIGH record (1 year)
Type : Bullish
Timeframe : Weekly
Near a new HIGH record (1st january)
Type : Bullish
Timeframe : Weekly
Near a new HIGH record (1 month)
Type : Bullish
Timeframe : Weekly
Technical
Technical analysis of this Daily chart of ENI indicates that the overall trend is strongly bullish. 92.86% of the signals given by moving averages are bullish. This strongly bullish trend is supported by the strong bullish signals given by short-term moving averages. The Central Indicators scanner does not detect any result on moving averages that would impact this trend.
Technical indicators are slightly bullish. There is therefore considerable uncertainty about the continuation of the increase.
The Central Indicators scanner found this result concerning these indicators:
Price is back over the pivot point
Type : Bullish
Timeframe : Daily
Central Patterns, the market scanner focusing on chart patterns, resistances and supports found this result:
Near horizontal support
Type : Bullish
Timeframe : Daily
Central Candlesticks, the scanner specialised in Japanese candlesticks, detects a bullish signal that could support the hypothesis of a small rebound in the very short term:
Bullish harami
Type : Bullish
Timeframe : Daily
| S3 | S2 | S1 | Price | R1 | R2 | R3 | |
|---|---|---|---|---|---|---|---|
| ProTrendLines | 11.833 | 12.238 | 12.746 | 13.456 | 13.531 | 16.645 | 18.540 |
| Change (%) | -12.06% | -9.05% | -5.28% | - | +0.56% | +23.70% | +37.78% |
| Change | -1.623 | -1.218 | -0.710 | - | +0.075 | +3.189 | +5.084 |
| Level | Intermediate | Major | Major | - | Major | Intermediate | Intermediate |
To determine price objectives, it is also possible to use the pivot points. Here is the price position in relation to pivot points:
| Pivot points | S3 | S2 | S1 | PP | R1 | R2 | R3 |
|---|---|---|---|---|---|---|---|
| Standard | 13.123 | 13.227 | 13.291 | 13.395 | 13.459 | 13.563 | 13.627 |
| Camarilla | 13.310 | 13.325 | 13.341 | 13.356 | 13.371 | 13.387 | 13.402 |
| Woodie | 13.104 | 13.217 | 13.272 | 13.385 | 13.440 | 13.553 | 13.608 |
| Fibonacci | 13.227 | 13.291 | 13.331 | 13.395 | 13.459 | 13.499 | 13.563 |
| Pivot points | S3 | S2 | S1 | PP | R1 | R2 | R3 |
|---|---|---|---|---|---|---|---|
| Standard | 11.559 | 12.069 | 12.821 | 13.331 | 14.083 | 14.593 | 15.345 |
| Camarilla | 13.227 | 13.343 | 13.458 | 13.574 | 13.690 | 13.805 | 13.921 |
| Woodie | 11.681 | 12.130 | 12.943 | 13.392 | 14.205 | 14.654 | 15.467 |
| Fibonacci | 12.069 | 12.551 | 12.849 | 13.331 | 13.813 | 14.111 | 14.593 |
| Pivot points | S3 | S2 | S1 | PP | R1 | R2 | R3 |
|---|---|---|---|---|---|---|---|
| Standard | 10.875 | 11.575 | 12.441 | 13.141 | 14.007 | 14.707 | 15.573 |
| Camarilla | 12.877 | 13.021 | 13.165 | 13.308 | 13.452 | 13.595 | 13.739 |
| Woodie | 10.959 | 11.617 | 12.525 | 13.183 | 14.091 | 14.749 | 15.657 |
| Fibonacci | 11.575 | 12.173 | 12.543 | 13.141 | 13.739 | 14.109 | 14.707 |
Numerical data
The following is the status of technical indicators and moving averages registered at the time this technical analysis was created:
| RSI (14): | 58.66 | |
| MACD (12,26,9): | 0.2680 | |
| Directional Movement: | 7.854 | |
| AROON (14): | 21.428 | |
| DEMA (21): | 13.474 | |
| Parabolic SAR (0,02-0,02-0,2): | 12.740 | |
| Elder Ray (13): | 0.051 | |
| Super Trend (3,10): | 12.608 | |
| Zig ZAG (10): | 13.456 | |
| VORTEX (21): | 1.0980 | |
| Stochastique (14,3,5): | 68.78 | |
| TEMA (21): | 13.568 | |
| Williams %R (14): | -30.43 | |
| Chande Momentum Oscillator (20): | 0.296 | |
| Repulse (5,40,3): | 1.6920 | |
| ROCnROLL: | 1 | |
| TRIX (15,9): | 0.3010 | |
| Courbe Coppock: | 8.18 |
| MA7: | 13.345 | |
| MA20: | 13.132 | |
| MA50: | 12.552 | |
| MA100: | 12.201 | |
| MAexp7: | 13.390 | |
| MAexp20: | 13.125 | |
| MAexp50: | 12.698 | |
| MAexp100: | 12.138 | |
| Price / MA7: | +0.83% | |
| Price / MA20: | +2.47% | |
| Price / MA50: | +7.20% | |
| Price / MA100: | +10.29% | |
| Price / MAexp7: | +0.49% | |
| Price / MAexp20: | +2.52% | |
| Price / MAexp50: | +5.97% | |
| Price / MAexp100: | +10.86% |
News
Don't forget to follow the news on ENI. At the time of publication of this analysis, the latest news was as follows:
- KNOT Awarded Long-Term Charters With ENI For Two New Shuttle Tankers With LNG Propulsion System
- Eni gas e luce Selects Medallia to Power Its Customer First CX Program
- Eni Gas & Power France Chooses Vlocity to Support Its Digital Transformation and to Improve Customer Experience in France
- Eni VP Andrew Lees to Keynote EnerCom's The Oil & Gas Conference® Aug. 14, 2019
- McDermott Awarded EPC Contract by ENI México for Amoca Field Offshore Mexico
About author

Online


Add a comment
Comments
0 comments on the analysis ENI - Daily