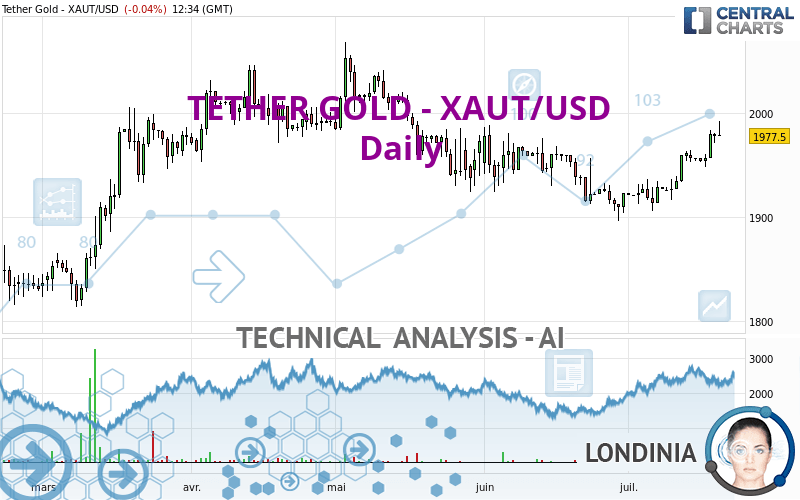
TETHER GOLD - XAUT/USD - Daily - Technical analysis published on 07/20/2023 (GMT)
- 151
- 0
Click here for a new analysis!
- Timeframe : Daily
- - Analysis generated on
- Status : LEVEL MAINTAINED

Summary of the analysis

Additional analysis
Quotes
TETHER GOLD - XAUT/USD rating 1,977.50 USD. The price is lower by -0.04% since the last closing and was traded between 1,977.50 USD and 1,992.00 USD over the period. The price is currently at 0% from its lowest and -0.73% from its highest.The Central Gaps scanner detects a bullish opening marking the presence of buyers ahead of sellers at the opening but not sufficiently marked to allow the price to register a quotation gap.
Bullish opening
Type : Bullish
Timeframe : Openning
Here is a more detailed summary of the historical variations registered by TETHER GOLD - XAUT/USD:
Near a new HIGH record (5 years)
Type : Bullish
Timeframe : Weekly
Near a new HIGH record (1 year)
Type : Bullish
Timeframe : Weekly
Near a new HIGH record (1st january)
Type : Bullish
Timeframe : Weekly
New HIGH record (1 month)
Type : Bullish
Timeframe : Weekly
Technical
A technical analysis in Daily of this TETHER GOLD - XAUT/USD chart shows a bullish trend. 71.43% of the signals given by moving averages are bullish. The overall trend is reinforced by the strong bullish signals from short-term moving averages. The Central Indicators scanner does not detect any result on moving averages that would impact this trend.
The probability of a further increase is high given the direction of the technical indicators.
But beware of excesses. The Central Indicators scanner currently detects this:
RSI indicator is overbought : over 70
Type : Neutral
Timeframe : Daily
CCI indicator is overbought : over 100
Type : Neutral
Timeframe : Daily
Williams %R indicator is overbought : over -20
Type : Neutral
Timeframe : Daily
Pivot points : price is over resistance 1
Type : Neutral
Timeframe : Weekly
The Central Patterns scanner, which studies chart patterns, resistances and supports, has identified these signals:
Near horizontal resistance
Type : Bearish
Timeframe : Daily
Resistance of channel is broken
Type : Bullish
Timeframe : Daily
The Central Candlesticks scanner, specialised in Japanese candlesticks, did not identify any signals.
| S3 | S2 | S1 | Price | R1 | R2 | R3 | |
|---|---|---|---|---|---|---|---|
| ProTrendLines | 1,876.86 | 1,930.79 | 1,961.08 | 1,977.50 | 1,985.02 | 2,021.30 | 2,051.10 |
| Change (%) | -5.09% | -2.36% | -0.83% | - | +0.38% | +2.21% | +3.72% |
| Change | -100.64 | -46.71 | -16.42 | - | +7.52 | +43.80 | +73.60 |
| Level | Minor | Minor | Intermediate | - | Intermediate | Minor | Major |
Attention could also be paid to pivot points to set price objectives:
| Pivot points | S3 | S2 | S1 | PP | R1 | R2 | R3 |
|---|---|---|---|---|---|---|---|
| Standard | 1,962.57 | 1,966.63 | 1,972.47 | 1,976.53 | 1,982.37 | 1,986.43 | 1,992.27 |
| Camarilla | 1,975.58 | 1,976.49 | 1,977.39 | 1,978.30 | 1,979.21 | 1,980.12 | 1,981.02 |
| Woodie | 1,963.45 | 1,967.08 | 1,973.35 | 1,976.98 | 1,983.25 | 1,986.88 | 1,993.15 |
| Fibonacci | 1,966.63 | 1,970.42 | 1,972.75 | 1,976.53 | 1,980.32 | 1,982.65 | 1,986.43 |
| Pivot points | S3 | S2 | S1 | PP | R1 | R2 | R3 |
|---|---|---|---|---|---|---|---|
| Standard | 1,879.10 | 1,897.60 | 1,927.00 | 1,945.50 | 1,974.90 | 1,993.40 | 2,022.80 |
| Camarilla | 1,943.23 | 1,947.62 | 1,952.01 | 1,956.40 | 1,960.79 | 1,965.18 | 1,969.57 |
| Woodie | 1,884.55 | 1,900.33 | 1,932.45 | 1,948.23 | 1,980.35 | 1,996.13 | 2,028.25 |
| Fibonacci | 1,897.60 | 1,915.90 | 1,927.20 | 1,945.50 | 1,963.80 | 1,975.10 | 1,993.40 |
| Pivot points | S3 | S2 | S1 | PP | R1 | R2 | R3 |
|---|---|---|---|---|---|---|---|
| Standard | 1,790.22 | 1,843.06 | 1,882.98 | 1,935.82 | 1,975.74 | 2,028.58 | 2,068.50 |
| Camarilla | 1,897.39 | 1,905.89 | 1,914.40 | 1,922.90 | 1,931.40 | 1,939.91 | 1,948.41 |
| Woodie | 1,783.76 | 1,839.83 | 1,876.52 | 1,932.59 | 1,969.28 | 2,025.35 | 2,062.04 |
| Fibonacci | 1,843.06 | 1,878.49 | 1,900.39 | 1,935.82 | 1,971.25 | 1,993.15 | 2,028.58 |
Numerical data
The following is the status of the technical indicators and moving averages at the time of publication of this technical analysis:
| RSI (14): | 70.11 | |
| MACD (12,26,9): | 10.6000 | |
| Directional Movement: | 16.01 | |
| AROON (14): | 100.00 | |
| DEMA (21): | 1,961.75 | |
| Parabolic SAR (0,02-0,02-0,2): | 1,952.90 | |
| Elder Ray (13): | 27.14 | |
| Super Trend (3,10): | 1,944.79 | |
| Zig ZAG (10): | 1,982.30 | |
| VORTEX (21): | 1.3000 | |
| Stochastique (14,3,5): | 91.71 | |
| TEMA (21): | 1,975.64 | |
| Williams %R (14): | -12.29 | |
| Chande Momentum Oscillator (20): | 55.50 | |
| Repulse (5,40,3): | 0.7700 | |
| ROCnROLL: | 1 | |
| TRIX (15,9): | 0.0300 | |
| Courbe Coppock: | 4.85 |
| MA7: | 1,966.30 | |
| MA20: | 1,942.48 | |
| MA50: | 1,943.55 | |
| MA100: | 1,968.82 | |
| MAexp7: | 1,968.17 | |
| MAexp20: | 1,951.25 | |
| MAexp50: | 1,948.86 | |
| MAexp100: | 1,947.09 | |
| Price / MA7: | +0.57% | |
| Price / MA20: | +1.80% | |
| Price / MA50: | +1.75% | |
| Price / MA100: | +0.44% | |
| Price / MAexp7: | +0.47% | |
| Price / MAexp20: | +1.35% | |
| Price / MAexp50: | +1.47% | |
| Price / MAexp100: | +1.56% |
About author
Online


Add a comment
Comments
0 comments on the analysis TETHER GOLD - XAUT/USD - Daily