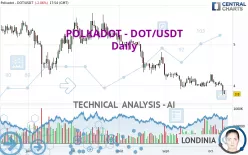
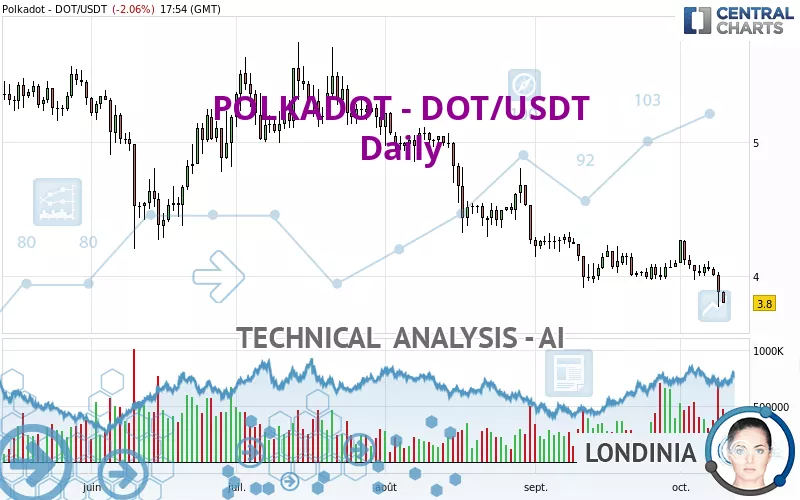
POLKADOT - DOT/USDT - Daily - Technical analysis published on 10/10/2023 (GMT)
- 281
- 0
Click here for a new analysis!
- Timeframe : Daily
- - Analysis generated on
- Status : INVALID
Summary of the analysis

Additional analysis
Quotes
The POLKADOT - DOT/USDT rating is 3.80 USDT. The price registered a decrease of -2.06% on the session and was between 3.80 USDT and 3.89 USDT. This implies that the price is at 0% from its lowest and at -2.31% from its highest.Here is a more detailed summary of the historical variations registered by POLKADOT - DOT/USDT:
Near a new LOW record (1 year)
Type : Bearish
Timeframe : Weekly
Near a new LOW record (1 month)
Type : Bearish
Timeframe : Weekly
Technical
Technical analysis of this Daily chart of POLKADOT - DOT/USDT indicates that the overall trend is strongly bearish. The signals given by moving averages are 92.86% bearish. This strong bearish trend is confirmed by the strong signals currently being given by short-term moving averages. The Central Indicators market scanner currently does not detect any result that concerns moving averages.
In fact, 11 technical indicators on 18 studied are currently bearish. But beware of excesses. The Central Indicators scanner currently detects this:
CCI indicator is oversold : under -100
Type : Neutral
Timeframe : Daily
Williams %R indicator is oversold : under -80
Type : Neutral
Timeframe : Daily
Pivot points : price is under support 1
Type : Neutral
Timeframe : Weekly
Central Patterns, the market scanner focusing on chart patterns, resistances and supports found this result:
Near support of channel
Type : Bullish
Timeframe : Daily
The Central Candlesticks scanner which studies Japanese candlesticks did not detect anything.
| Price | R1 | R2 | R3 | |
|---|---|---|---|---|
| ProTrendLines | 3.80 | 3.99 | 4.28 | 5.53 |
| Change (%) | - | +5.00% | +12.63% | +45.53% |
| Change | - | +0.19 | +0.48 | +1.73 |
| Level | - | Major | Intermediate | Intermediate |
Attention could also be paid to pivot points to set price objectives:
| Pivot points | S3 | S2 | S1 | PP | R1 | R2 | R3 |
|---|---|---|---|---|---|---|---|
| Standard | 3.50 | 3.63 | 3.76 | 3.89 | 4.02 | 4.15 | 4.28 |
| Camarilla | 3.81 | 3.83 | 3.86 | 3.88 | 3.90 | 3.93 | 3.95 |
| Woodie | 3.49 | 3.63 | 3.75 | 3.89 | 4.01 | 4.15 | 4.27 |
| Fibonacci | 3.63 | 3.73 | 3.79 | 3.89 | 3.99 | 4.05 | 4.15 |
| Pivot points | S3 | S2 | S1 | PP | R1 | R2 | R3 |
|---|---|---|---|---|---|---|---|
| Standard | 3.62 | 3.80 | 3.92 | 4.10 | 4.22 | 4.40 | 4.52 |
| Camarilla | 3.97 | 4.00 | 4.02 | 4.05 | 4.08 | 4.11 | 4.13 |
| Woodie | 3.60 | 3.79 | 3.90 | 4.09 | 4.20 | 4.39 | 4.50 |
| Fibonacci | 3.80 | 3.91 | 3.98 | 4.10 | 4.21 | 4.28 | 4.40 |
| Pivot points | S3 | S2 | S1 | PP | R1 | R2 | R3 |
|---|---|---|---|---|---|---|---|
| Standard | 3.48 | 3.69 | 3.90 | 4.11 | 4.32 | 4.53 | 4.74 |
| Camarilla | 3.99 | 4.02 | 4.06 | 4.10 | 4.14 | 4.18 | 4.22 |
| Woodie | 3.47 | 3.69 | 3.89 | 4.11 | 4.31 | 4.53 | 4.73 |
| Fibonacci | 3.69 | 3.85 | 3.95 | 4.11 | 4.27 | 4.37 | 4.53 |
Numerical data
The following are the details of the technical indicators and moving averages that were collected to generate this technical analysis:
| RSI (14): | 32.74 | |
| MACD (12,26,9): | -0.0700 | |
| Directional Movement: | -16.73 | |
| AROON (14): | -57.15 | |
| DEMA (21): | 3.95 | |
| Parabolic SAR (0,02-0,02-0,2): | 4.22 | |
| Elder Ray (13): | -0.16 | |
| Super Trend (3,10): | 4.19 | |
| Zig ZAG (10): | 3.81 | |
| VORTEX (21): | 0.8700 | |
| Stochastique (14,3,5): | 14.84 | |
| TEMA (21): | 3.97 | |
| Williams %R (14): | -91.86 | |
| Chande Momentum Oscillator (20): | -0.26 | |
| Repulse (5,40,3): | -5.4300 | |
| ROCnROLL: | 2 | |
| TRIX (15,9): | -0.1900 | |
| Courbe Coppock: | 2.96 |
| MA7: | 3.98 | |
| MA20: | 4.04 | |
| MA50: | 4.18 | |
| MA100: | 4.64 | |
| MAexp7: | 3.96 | |
| MAexp20: | 4.04 | |
| MAexp50: | 4.22 | |
| MAexp100: | 4.52 | |
| Price / MA7: | -4.52% | |
| Price / MA20: | -5.94% | |
| Price / MA50: | -9.09% | |
| Price / MA100: | -18.10% | |
| Price / MAexp7: | -4.04% | |
| Price / MAexp20: | -5.94% | |
| Price / MAexp50: | -9.95% | |
| Price / MAexp100: | -15.93% |
About author

Online


Add a comment
Comments
0 comments on the analysis POLKADOT - DOT/USDT - Daily