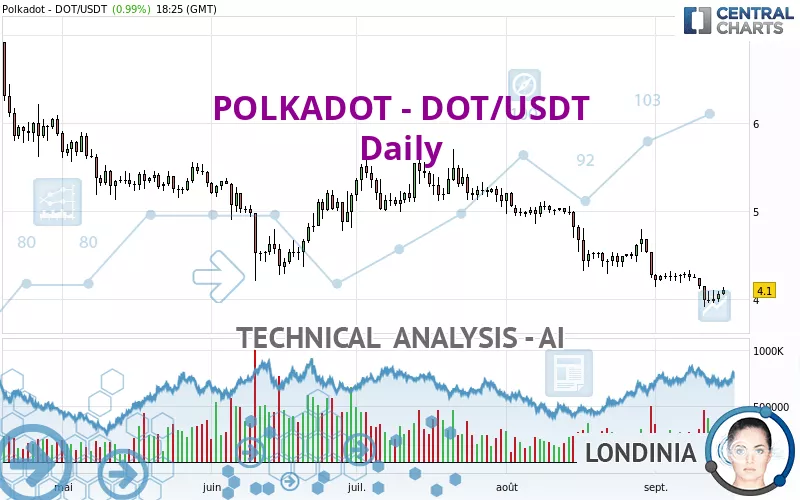
POLKADOT - DOT/USDT - Daily - Technical analysis published on 09/15/2023 (GMT)
- 245
- 0
- Who voted?
Click here for a new analysis!
- Timeframe : Daily
- - Analysis generated on
- Status : LEVEL MAINTAINED

Summary of the analysis

Additional analysis
Quotes
POLKADOT - DOT/USDT rating 4.10 USDT. On the day, this instrument gained +0.99% with the lowest point at 4.05 USDT and the highest point at 4.14 USDT. The deviation from the price is +1.23% for the low point and -0.97% for the high point.The Central Gaps scanner detects a bearish opening marking the presence of sellers ahead of buyers at the opening but not sufficiently marked to allow the price to register a quotation gap.
Bearish opening
Type : Bearish
Timeframe : Openning
Here is a more detailed summary of the historical variations registered by POLKADOT - DOT/USDT:
Near a new LOW record (1 year)
Type : Bearish
Timeframe : Weekly
Near a new LOW record (1st january)
Type : Bearish
Timeframe : Weekly
Near a new LOW record (1 month)
Type : Bearish
Timeframe : Weekly
Technical
Technical analysis of POLKADOT - DOT/USDT in Daily shows a overall strongly bearish trend. 92.86% of the signals given by moving averages are bearish. The overall trend is supported by the strong bearish signals from short-term moving averages. There is no crossing of moving average by the price or crossing of moving averages between themselves.
The technical indicators are generally neutral. They do not provide relevant information on the direction of future price movements.
Central Indicators, the detector scanner for these technical indicators has recently detected several signals:
Pivot points : price is under support 1
Type : Neutral
Timeframe : Weekly
MACD crosses UP its Moving Average
Type : Bullish
Timeframe : Daily
The analysis of the price chart with Central Patterns scanners does not return any result.
No result was found by the Central Candlesticks scanner on Japanese candlesticks.
| Price | R1 | R2 | R3 | |
|---|---|---|---|---|
| ProTrendLines | 4.10 | 4.68 | 5.50 | 5.86 |
| Change (%) | - | +14.15% | +34.15% | +42.93% |
| Change | - | +0.58 | +1.40 | +1.76 |
| Level | - | Minor | Intermediate | Intermediate |
Pivot points can also be used to set your price objectives. Here is the price situation in relation to pivot points:
| Pivot points | S3 | S2 | S1 | PP | R1 | R2 | R3 |
|---|---|---|---|---|---|---|---|
| Standard | 3.87 | 3.92 | 3.99 | 4.04 | 4.11 | 4.16 | 4.23 |
| Camarilla | 4.03 | 4.04 | 4.05 | 4.06 | 4.07 | 4.08 | 4.09 |
| Woodie | 3.88 | 3.93 | 4.00 | 4.05 | 4.12 | 4.17 | 4.24 |
| Fibonacci | 3.92 | 3.97 | 3.99 | 4.04 | 4.09 | 4.11 | 4.16 |
| Pivot points | S3 | S2 | S1 | PP | R1 | R2 | R3 |
|---|---|---|---|---|---|---|---|
| Standard | 4.02 | 4.10 | 4.17 | 4.25 | 4.32 | 4.40 | 4.47 |
| Camarilla | 4.20 | 4.21 | 4.23 | 4.24 | 4.25 | 4.27 | 4.28 |
| Woodie | 4.02 | 4.10 | 4.17 | 4.25 | 4.32 | 4.40 | 4.47 |
| Fibonacci | 4.10 | 4.16 | 4.19 | 4.25 | 4.31 | 4.34 | 4.40 |
| Pivot points | S3 | S2 | S1 | PP | R1 | R2 | R3 |
|---|---|---|---|---|---|---|---|
| Standard | 2.95 | 3.60 | 3.93 | 4.58 | 4.91 | 5.56 | 5.89 |
| Camarilla | 4.00 | 4.09 | 4.18 | 4.27 | 4.36 | 4.45 | 4.54 |
| Woodie | 2.80 | 3.52 | 3.78 | 4.50 | 4.76 | 5.48 | 5.74 |
| Fibonacci | 3.60 | 3.97 | 4.20 | 4.58 | 4.95 | 5.18 | 5.56 |
Numerical data
The following is the status of technical indicators and moving averages registered at the time this technical analysis was created:
| RSI (14): | 34.78 | |
| MACD (12,26,9): | -0.1600 | |
| Directional Movement: | -18.98 | |
| AROON (14): | -21.43 | |
| DEMA (21): | 4.02 | |
| Parabolic SAR (0,02-0,02-0,2): | 4.38 | |
| Elder Ray (13): | -0.07 | |
| Super Trend (3,10): | 4.43 | |
| Zig ZAG (10): | 4.10 | |
| VORTEX (21): | 0.8900 | |
| Stochastique (14,3,5): | 31.86 | |
| TEMA (21): | 4.01 | |
| Williams %R (14): | -54.39 | |
| Chande Momentum Oscillator (20): | -0.16 | |
| Repulse (5,40,3): | 0.4900 | |
| ROCnROLL: | 2 | |
| TRIX (15,9): | -0.5200 | |
| Courbe Coppock: | 13.91 |
| MA7: | 4.07 | |
| MA20: | 4.26 | |
| MA50: | 4.61 | |
| MA100: | 4.83 | |
| MAexp7: | 4.09 | |
| MAexp20: | 4.24 | |
| MAexp50: | 4.52 | |
| MAexp100: | 4.81 | |
| Price / MA7: | +0.74% | |
| Price / MA20: | -3.76% | |
| Price / MA50: | -11.06% | |
| Price / MA100: | -15.11% | |
| Price / MAexp7: | +0.24% | |
| Price / MAexp20: | -3.30% | |
| Price / MAexp50: | -9.29% | |
| Price / MAexp100: | -14.76% |
About author

Online


Add a comment
Comments
0 comments on the analysis POLKADOT - DOT/USDT - Daily