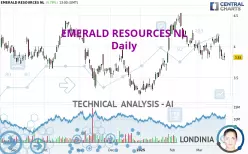
EMERALD RESOURCES NL - Daily - Technical analysis published on 03/26/2025 (GMT)
- 93
- 0
Click here for a new analysis!
- Timeframe : Daily
- - Analysis generated on
- Status : TARGET REACHED

Summary of the analysis

Additional analysis
Quotes
The EMERALD RESOURCES NL price is 3.830 AUD. The price has increased by +0.79% since the last closing and was between 3.780 AUD and 3.900 AUD. This implies that the price is at +1.32% from its lowest and at -1.79% from its highest.The Central Gaps scanner detects a bullish opening marking the presence of buyers ahead of sellers at the opening but not sufficiently marked to allow the price to register a quotation gap.
Bullish opening
Type : Bullish
Timeframe : Openning
Here is a more detailed summary of the historical variations registered by EMERALD RESOURCES NL:
New LOW record (1 month)
Type : Bearish
Timeframe : Weekly
Technical
A technical analysis in Daily of this EMERALD RESOURCES NL chart shows a slightly bearish trend. 60.71% of the signals given by moving averages are bearish. The overall trend could accelerate as a result of the strong bearish signals from short-term moving averages. The Central Indicators market scanner is currently detecting a bullish signal that could impact this trend:
Bullish price crossover with Moving Average 100
Type : Bullish
Timeframe : Daily
The probability of a further decline is moderate given the direction of the technical indicators.
Caution: the Central Indicators scanner currently detects an excess:
CCI indicator is oversold : under -100
Type : Neutral
Timeframe : Daily
Williams %R indicator is oversold : under -80
Type : Neutral
Timeframe : Daily
Central Patterns, the market scanner focusing on chart patterns, resistances and supports found this result:
Support of channel is broken
Type : Bearish
Timeframe : Daily
No result was found by the Central Candlesticks scanner on Japanese candlesticks.
| S3 | S2 | S1 | Price | R1 | R2 | R3 | |
|---|---|---|---|---|---|---|---|
| ProTrendLines | 3.460 | 3.560 | 3.740 | 3.830 | 4.047 | 4.140 | 4.410 |
| Change (%) | -9.66% | -7.05% | -2.35% | - | +5.67% | +8.09% | +15.14% |
| Change | -0.370 | -0.270 | -0.090 | - | +0.217 | +0.310 | +0.580 |
| Level | Minor | Minor | Major | - | Minor | Intermediate | Major |
Pivot points can also be used to set your price objectives. Here is the price situation in relation to pivot points:
| Pivot points | S3 | S2 | S1 | PP | R1 | R2 | R3 |
|---|---|---|---|---|---|---|---|
| Standard | 3.653 | 3.717 | 3.773 | 3.837 | 3.893 | 3.957 | 4.013 |
| Camarilla | 3.797 | 3.808 | 3.819 | 3.830 | 3.841 | 3.852 | 3.863 |
| Woodie | 3.650 | 3.715 | 3.770 | 3.835 | 3.890 | 3.955 | 4.010 |
| Fibonacci | 3.717 | 3.763 | 3.791 | 3.837 | 3.883 | 3.911 | 3.957 |
| Pivot points | S3 | S2 | S1 | PP | R1 | R2 | R3 |
|---|---|---|---|---|---|---|---|
| Standard | 3.423 | 3.617 | 3.808 | 4.002 | 4.193 | 4.387 | 4.578 |
| Camarilla | 3.894 | 3.929 | 3.965 | 4.000 | 4.035 | 4.071 | 4.106 |
| Woodie | 3.423 | 3.616 | 3.808 | 4.001 | 4.193 | 4.386 | 4.578 |
| Fibonacci | 3.617 | 3.764 | 3.855 | 4.002 | 4.149 | 4.240 | 4.387 |
| Pivot points | S3 | S2 | S1 | PP | R1 | R2 | R3 |
|---|---|---|---|---|---|---|---|
| Standard | 3.150 | 3.540 | 3.760 | 4.150 | 4.370 | 4.760 | 4.980 |
| Camarilla | 3.812 | 3.868 | 3.924 | 3.980 | 4.036 | 4.092 | 4.148 |
| Woodie | 3.065 | 3.498 | 3.675 | 4.108 | 4.285 | 4.718 | 4.895 |
| Fibonacci | 3.540 | 3.773 | 3.917 | 4.150 | 4.383 | 4.527 | 4.760 |
Numerical data
The following is the status of technical indicators and moving averages registered at the time this technical analysis was created:
| RSI (14): | 42.50 | |
| MACD (12,26,9): | -0.0250 | |
| Directional Movement: | -4.668 | |
| AROON (14): | -35.714 | |
| DEMA (21): | 3.964 | |
| Parabolic SAR (0,02-0,02-0,2): | 4.149 | |
| Elder Ray (13): | -0.124 | |
| Super Trend (3,10): | 4.284 | |
| Zig ZAG (10): | 3.830 | |
| VORTEX (21): | 0.7990 | |
| Stochastique (14,3,5): | 9.06 | |
| TEMA (21): | 3.899 | |
| Williams %R (14): | -87.95 | |
| Chande Momentum Oscillator (20): | -0.190 | |
| Repulse (5,40,3): | -1.1800 | |
| ROCnROLL: | 2 | |
| TRIX (15,9): | -0.0060 | |
| Courbe Coppock: | 1.09 |
| MA7: | 3.977 | |
| MA20: | 3.982 | |
| MA50: | 3.978 | |
| MA100: | 3.808 | |
| MAexp7: | 3.923 | |
| MAexp20: | 3.982 | |
| MAexp50: | 3.948 | |
| MAexp100: | 3.880 | |
| Price / MA7: | -3.70% | |
| Price / MA20: | -3.82% | |
| Price / MA50: | -3.72% | |
| Price / MA100: | +0.58% | |
| Price / MAexp7: | -2.37% | |
| Price / MAexp20: | -3.82% | |
| Price / MAexp50: | -2.99% | |
| Price / MAexp100: | -1.29% |
About author

Online


Add a comment
Comments
0 comments on the analysis EMERALD RESOURCES NL - Daily