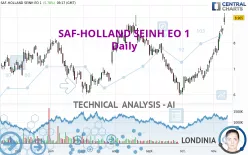
SAF-HOLLAND SEINH EO 1 - Daily - Technical analysis published on 11/10/2022 (GMT)
- 148
- 0
Click here for a new analysis!
- Timeframe : Daily
- - Analysis generated on
- Status : LEVEL MAINTAINED

Summary of the analysis

Additional analysis
Quotes
SAF-HOLLAND SEINH EO 1 rating 8.965 EUR. On the day, this instrument gained +5.78% and was between 8.695 EUR and 9.150 EUR. This implies that the price is at +3.11% from its lowest and at -2.02% from its highest.The Central Gaps scanner detects the formation of a bullish gap marking the strong presence of buyers against sellers at the opening. This formed a quotation gap.
Opening Gap UP
Type : Bullish
Timeframe : Openning
So that you have an overall view of the price change, here is a table showing the variations over several periods:
New HIGH record (1 month)
Type : Bullish
Timeframe : Weekly
Technical
Technical analysis of this Daily chart of SAF-HOLLAND SEINH EO 1 indicates that the overall trend is strongly bullish. 85.71% of the signals given by moving averages are bullish. The overall trend is supported by the strong bullish signals from short-term moving averages. There is no crossing of moving average by the price or crossing of moving averages between themselves.
In fact, 15 technical indicators on 18 studied are currently bullish. But beware of excesses. The Central Indicators scanner currently detects this:
RSI indicator is overbought : over 80
Type : Neutral
Timeframe : Daily
CCI indicator is overbought : over 100
Type : Neutral
Timeframe : Daily
Williams %R indicator is overbought : over -20
Type : Neutral
Timeframe : Daily
Pivot points : price is over resistance 2
Type : Neutral
Timeframe : Weekly
Pivot points : price is over resistance 3
Type : Neutral
Timeframe : Daily
An analysis of the price chart with the Central Patterns scanner (detector of chart patterns and resistances and supports) shows a result that can have an impact on the price change:
Near resistance of channel
Type : Bearish
Timeframe : Daily
The Central Candlesticks scanner which studies Japanese candlesticks did not detect anything.
| S3 | S2 | S1 | Price | R1 | R2 | R3 | |
|---|---|---|---|---|---|---|---|
| ProTrendLines | 7.113 | 8.081 | 8.560 | 8.965 | 9.686 | 10.176 | 10.651 |
| Change (%) | -20.66% | -9.86% | -4.52% | - | +8.04% | +13.51% | +18.81% |
| Change | -1.852 | -0.884 | -0.405 | - | +0.721 | +1.211 | +1.686 |
| Level | Intermediate | Intermediate | Major | - | Minor | Intermediate | Minor |
Attention could also be paid to pivot points to set price objectives:
| Pivot points | S3 | S2 | S1 | PP | R1 | R2 | R3 |
|---|---|---|---|---|---|---|---|
| Standard | 8.127 | 8.228 | 8.352 | 8.453 | 8.577 | 8.678 | 8.802 |
| Camarilla | 8.413 | 8.434 | 8.454 | 8.475 | 8.496 | 8.516 | 8.537 |
| Woodie | 8.138 | 8.234 | 8.363 | 8.459 | 8.588 | 8.684 | 8.813 |
| Fibonacci | 8.228 | 8.314 | 8.367 | 8.453 | 8.539 | 8.592 | 8.678 |
| Pivot points | S3 | S2 | S1 | PP | R1 | R2 | R3 |
|---|---|---|---|---|---|---|---|
| Standard | 6.737 | 7.053 | 7.592 | 7.908 | 8.447 | 8.763 | 9.302 |
| Camarilla | 7.895 | 7.973 | 8.052 | 8.130 | 8.208 | 8.287 | 8.365 |
| Woodie | 6.848 | 7.109 | 7.703 | 7.964 | 8.558 | 8.819 | 9.413 |
| Fibonacci | 7.053 | 7.380 | 7.582 | 7.908 | 8.235 | 8.437 | 8.763 |
| Pivot points | S3 | S2 | S1 | PP | R1 | R2 | R3 |
|---|---|---|---|---|---|---|---|
| Standard | 4.890 | 5.445 | 6.470 | 7.025 | 8.050 | 8.605 | 9.630 |
| Camarilla | 7.061 | 7.205 | 7.350 | 7.495 | 7.640 | 7.785 | 7.930 |
| Woodie | 5.125 | 5.563 | 6.705 | 7.143 | 8.285 | 8.723 | 9.865 |
| Fibonacci | 5.445 | 6.049 | 6.421 | 7.025 | 7.629 | 8.001 | 8.605 |
Numerical data
The following are the details of the technical indicators and moving averages that were collected to generate this technical analysis:
| RSI (14): | 81.63 | |
| MACD (12,26,9): | 0.4500 | |
| Directional Movement: | 38.137 | |
| AROON (14): | 100.000 | |
| DEMA (21): | 8.208 | |
| Parabolic SAR (0,02-0,02-0,2): | 7.830 | |
| Elder Ray (13): | 0.942 | |
| Super Trend (3,10): | 7.961 | |
| Zig ZAG (10): | 9.025 | |
| VORTEX (21): | 1.3040 | |
| Stochastique (14,3,5): | 93.31 | |
| TEMA (21): | 8.633 | |
| Williams %R (14): | -6.60 | |
| Chande Momentum Oscillator (20): | 2.050 | |
| Repulse (5,40,3): | 5.1260 | |
| ROCnROLL: | 1 | |
| TRIX (15,9): | 0.5450 | |
| Courbe Coppock: | 42.87 |
| MA7: | 8.286 | |
| MA20: | 7.485 | |
| MA50: | 7.180 | |
| MA100: | 7.300 | |
| MAexp7: | 8.338 | |
| MAexp20: | 7.712 | |
| MAexp50: | 7.399 | |
| MAexp100: | 7.476 | |
| Price / MA7: | +8.19% | |
| Price / MA20: | +19.77% | |
| Price / MA50: | +24.86% | |
| Price / MA100: | +22.81% | |
| Price / MAexp7: | +7.52% | |
| Price / MAexp20: | +16.25% | |
| Price / MAexp50: | +21.17% | |
| Price / MAexp100: | +19.92% |
News
Don't forget to follow the news on SAF-HOLLAND SEINH EO 1. At the time of publication of this analysis, the latest news was as follows:
- EQS-News: SAF-HOLLAND SE with double-digit sales growth and improved adjusted EBIT margin also in the third quarter of 2022
- EQS-News: SAF-HOLLAND SE prolongs contract with the Chairman of the Management Board ahead of schedule
- EQS-News: SAF-HOLLAND: Promissory note loan for refinancing successfully placed – originally targeted volume of at least EUR 100 million upsized to EUR 176 million due to over-subscription
- DGAP-News: SAF-HOLLAND announces outcome of the extended acceptance period of the offer to the shareholders of Haldex
- DGAP-News: SAF-HOLLAND successfully completes the offer for Haldex at more than 93% and extends acceptance period
About author
Online


Add a comment
Comments
0 comments on the analysis SAF-HOLLAND SEINH EO 1 - Daily