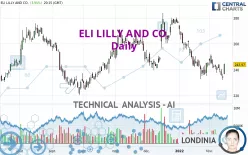
ELI LILLY AND CO. - Daily - Technical analysis published on 02/15/2022 (GMT)
- 292
- 0
- Timeframe : Daily
- - Analysis generated on
- Status : NEUTRAL

Summary of the analysis

Additional analysis
Quotes
The ELI LILLY AND CO. price is 243.97 USD. The price registered an increase of +3.95% on the session and was between 236.65 USD and 244.79 USD. This implies that the price is at +3.09% from its lowest and at -0.33% from its highest.The Central Gaps scanner detects a bullish opening marking the presence of buyers ahead of sellers at the opening but not sufficiently marked to allow the price to register a quotation gap.
Bullish opening
Type : Bullish
Timeframe : Openning
A study of price movements over other periods shows the following variations:
Near a new LOW record (1st january)
Type : Bearish
Timeframe : Weekly
Near a new HIGH record (1 month)
Type : Bullish
Timeframe : Weekly
Technical
Technical analysis of this Daily chart of ELI LILLY AND CO. indicates that the overall trend is slightly bearish. Only 57.14% of the signals given by moving averages are bearish. This slightly bearish trend could return to neutral given the neutral signals also given by short-term moving averages. An assessment of moving averages reveals several bullish signals that could impact this trend:
Bullish price crossover with Moving Average 20
Type : Bullish
Timeframe : Daily
Bullish price crossover with adaptative moving average 20
Type : Bullish
Timeframe : Daily
The probability of a further increase is slight given the direction of the technical indicators.
Caution: the Central Indicators scanner currently detects an excess:
MACD indicator: bullish divergence
Type : Bullish
Timeframe : Daily
RSI indicator: bullish divergence
Type : Bullish
Timeframe : Daily
Pivot points : price is over resistance 1
Type : Neutral
Timeframe : Weekly
Pivot points : price is over resistance 3
Type : Neutral
Timeframe : Daily
MACD crosses UP its Moving Average
Type : Bullish
Timeframe : Daily
Momentum indicator is back over 0
Type : Bullish
Timeframe : Daily
Williams %R indicator is back over -50
Type : Bullish
Timeframe : Daily
Central Patterns, the market scanner focusing on chart patterns, resistances and supports found this result:
Near horizontal support
Type : Bullish
Timeframe : Daily
Central Candlesticks, the scanner specialised in Japanese candlesticks, detects a bullish signal that could support the hypothesis of a small rebound in the very short term:
White morning star
Type : Bullish
Timeframe : Daily
| S3 | S2 | S1 | Price | R1 | R2 | R3 | |
|---|---|---|---|---|---|---|---|
| ProTrendLines | 212.72 | 221.60 | 242.90 | 243.97 | 250.83 | 262.11 | 272.71 |
| Change (%) | -12.81% | -9.17% | -0.44% | - | +2.81% | +7.44% | +11.78% |
| Change | -31.25 | -22.37 | -1.07 | - | +6.86 | +18.14 | +28.74 |
| Level | Intermediate | Major | Major | - | Intermediate | Intermediate | Major |
Pivot points can also be used to set your price objectives. Here is the price situation in relation to pivot points:
| Pivot points | S3 | S2 | S1 | PP | R1 | R2 | R3 |
|---|---|---|---|---|---|---|---|
| Standard | 227.07 | 229.47 | 232.08 | 234.48 | 237.09 | 239.49 | 242.10 |
| Camarilla | 233.31 | 233.77 | 234.23 | 234.69 | 235.15 | 235.61 | 236.07 |
| Woodie | 227.18 | 229.52 | 232.19 | 234.53 | 237.20 | 239.54 | 242.21 |
| Fibonacci | 229.47 | 231.38 | 232.57 | 234.48 | 236.39 | 237.58 | 239.49 |
| Pivot points | S3 | S2 | S1 | PP | R1 | R2 | R3 |
|---|---|---|---|---|---|---|---|
| Standard | 221.70 | 227.79 | 231.27 | 237.36 | 240.84 | 246.93 | 250.41 |
| Camarilla | 232.13 | 233.01 | 233.88 | 234.76 | 235.64 | 236.52 | 237.39 |
| Woodie | 220.41 | 227.14 | 229.98 | 236.71 | 239.55 | 246.28 | 249.12 |
| Fibonacci | 227.79 | 231.44 | 233.70 | 237.36 | 241.01 | 243.27 | 246.93 |
| Pivot points | S3 | S2 | S1 | PP | R1 | R2 | R3 |
|---|---|---|---|---|---|---|---|
| Standard | 184.74 | 208.22 | 226.30 | 249.78 | 267.86 | 291.34 | 309.42 |
| Camarilla | 232.94 | 236.75 | 240.56 | 244.37 | 248.18 | 251.99 | 255.80 |
| Woodie | 182.03 | 206.87 | 223.59 | 248.43 | 265.15 | 289.99 | 306.71 |
| Fibonacci | 208.22 | 224.10 | 233.91 | 249.78 | 265.66 | 275.47 | 291.34 |
Numerical data
The following are the details of the technical indicators and moving averages that were collected to generate this technical analysis:
| RSI (14): | 49.20 | |
| MACD (12,26,9): | -3.7800 | |
| Directional Movement: | -3.75 | |
| AROON (14): | -57.15 | |
| DEMA (21): | 237.88 | |
| Parabolic SAR (0,02-0,02-0,2): | 249.75 | |
| Elder Ray (13): | -0.46 | |
| Super Trend (3,10): | 252.54 | |
| Zig ZAG (10): | 244.23 | |
| VORTEX (21): | 0.9100 | |
| Stochastique (14,3,5): | 28.36 | |
| TEMA (21): | 236.88 | |
| Williams %R (14): | -35.24 | |
| Chande Momentum Oscillator (20): | 0.07 | |
| Repulse (5,40,3): | 3.2300 | |
| ROCnROLL: | -1 | |
| TRIX (15,9): | -0.2600 | |
| Courbe Coppock: | 1.03 |
| MA7: | 239.44 | |
| MA20: | 241.26 | |
| MA50: | 252.54 | |
| MA100: | 249.16 | |
| MAexp7: | 239.92 | |
| MAexp20: | 243.12 | |
| MAexp50: | 248.23 | |
| MAexp100: | 247.28 | |
| Price / MA7: | +1.89% | |
| Price / MA20: | +1.12% | |
| Price / MA50: | -3.39% | |
| Price / MA100: | -2.08% | |
| Price / MAexp7: | +1.69% | |
| Price / MAexp20: | +0.35% | |
| Price / MAexp50: | -1.72% | |
| Price / MAexp100: | -1.34% |
News
The last news published on ELI LILLY AND CO. at the time of the generation of this analysis was as follows:
- Baricitinib in Combination with Remdesivir Reduces Time to Recovery in Hospitalized Patients with COVID-19 in NIAID-Sponsored ACTT-2 Trial
- Eli Lilly and Company: Eli Lilly and Company Files 10-Q
- Eli Lilly and Company: Eli Lilly and Company Files 8-K
- Eli Lilly and Company: Eli Lilly and Company Files Form 4
- Eli Lilly and Company: Eli Lilly and Company Files 8-K
About author

Online


Add a comment
Comments
0 comments on the analysis ELI LILLY AND CO. - Daily