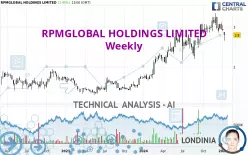
RPMGLOBAL HOLDINGS LIMITED - Weekly - Technical analysis published on 01/17/2025 (GMT)
- 66
- 0
- Timeframe : Weekly
- - Analysis generated on
- Status : IN PROGRESS...

Summary of the analysis

Additional analysis
Quotes
The RPMGLOBAL HOLDINGS LIMITED price is 2.800 AUD. The price is lower by -4.76% over the 5 days with the lowest point at 2.660 AUD and the highest point at 2.880 AUD. The deviation from the price is +5.26% for the low point and -2.78% for the high point.Here is a more detailed summary of the historical variations registered by RPMGLOBAL HOLDINGS LIMITED:
Near a new LOW record (1st january)
Type : Bearish
Timeframe : Weekly
Near a new LOW record (1 month)
Type : Bearish
Timeframe : Weekly
Technical
A technical analysis in Weekly of this RPMGLOBAL HOLDINGS LIMITED chart shows a bullish trend. The signals given by moving averages are 75.00% bullish. This bullish trend could slow down given the neutral signals currently being given by short-term moving averages. The Central Indicators market scanner is currently detecting a bearish signal that could impact this trend:
Bearish price crossover with adaptative moving average 50
Type : Bearish
Timeframe : Weekly
An assessment of technical indicators does not currently provide any relevant information on the direction of future price movements.
Central Indicators, the detector scanner for these technical indicators has recently detected several signals:
Pivot points : price is under support 3
Type : Neutral
Timeframe : Weekly
RSI indicator is back under 50
Type : Bearish
Timeframe : Weekly
Parabolic SAR indicator bearish reversal
Type : Bearish
Timeframe : Weekly
An analysis of the price chart with the Central Patterns scanner (detector of chart patterns and resistances and supports) shows a result that can have an impact on the price change:
Near support of channel
Type : Bullish
Timeframe : Weekly
Central Candlesticks, the scanner specialised in Japanese candlesticks, detects a bearish signal that could support the hypothesis of a small drop in the very short term:
Downside gap
Type : Bearish
Timeframe : Weekly
| S3 | S2 | S1 | Price | R1 | R2 | R3 | |
|---|---|---|---|---|---|---|---|
| ProTrendLines | 1.330 | 1.721 | 2.220 | 2.800 | 2.870 | 3.060 | 3.340 |
| Change (%) | -52.50% | -38.54% | -20.71% | - | +2.50% | +9.29% | +19.29% |
| Change | -1.470 | -1.079 | -0.580 | - | +0.070 | +0.260 | +0.540 |
| Level | Major | Intermediate | Major | - | Intermediate | Intermediate | Major |
Pivot points can also be used to set your price objectives. Here is the price situation in relation to pivot points:
| Pivot points | S3 | S2 | S1 | PP | R1 | R2 | R3 |
|---|---|---|---|---|---|---|---|
| Standard | 2.693 | 2.727 | 2.763 | 2.797 | 2.833 | 2.867 | 2.903 |
| Camarilla | 2.781 | 2.787 | 2.794 | 2.800 | 2.806 | 2.813 | 2.819 |
| Woodie | 2.695 | 2.728 | 2.765 | 2.798 | 2.835 | 2.868 | 2.905 |
| Fibonacci | 2.727 | 2.753 | 2.770 | 2.797 | 2.823 | 2.840 | 2.867 |
| Pivot points | S3 | S2 | S1 | PP | R1 | R2 | R3 |
|---|---|---|---|---|---|---|---|
| Standard | 2.705 | 2.800 | 2.860 | 2.955 | 3.015 | 3.110 | 3.170 |
| Camarilla | 2.877 | 2.892 | 2.906 | 2.920 | 2.934 | 2.948 | 2.963 |
| Woodie | 2.688 | 2.791 | 2.843 | 2.946 | 2.998 | 3.101 | 3.153 |
| Fibonacci | 2.800 | 2.859 | 2.896 | 2.955 | 3.014 | 3.051 | 3.110 |
| Pivot points | S3 | S2 | S1 | PP | R1 | R2 | R3 |
|---|---|---|---|---|---|---|---|
| Standard | 2.333 | 2.597 | 2.823 | 3.087 | 3.313 | 3.577 | 3.803 |
| Camarilla | 2.915 | 2.960 | 3.005 | 3.050 | 3.095 | 3.140 | 3.185 |
| Woodie | 2.315 | 2.588 | 2.805 | 3.078 | 3.295 | 3.568 | 3.785 |
| Fibonacci | 2.597 | 2.784 | 2.900 | 3.087 | 3.274 | 3.390 | 3.577 |
Numerical data
The following is the status of technical indicators and moving averages registered at the time this technical analysis was created:
| RSI (14): | 48.61 | |
| MACD (12,26,9): | 0.1000 | |
| Directional Movement: | 0.052 | |
| AROON (14): | -42.857 | |
| DEMA (21): | 3.058 | |
| Parabolic SAR (0,02-0,02-0,2): | 3.350 | |
| Elder Ray (13): | -0.174 | |
| Super Trend (3,10): | 2.519 | |
| Zig ZAG (10): | 2.800 | |
| VORTEX (21): | 1.0640 | |
| Stochastique (14,3,5): | 20.23 | |
| TEMA (21): | 2.999 | |
| Williams %R (14): | -79.71 | |
| Chande Momentum Oscillator (20): | -0.150 | |
| Repulse (5,40,3): | -5.6940 | |
| ROCnROLL: | -1 | |
| TRIX (15,9): | 0.7690 | |
| Courbe Coppock: | 11.13 |
| MA7: | 2.840 | |
| MA20: | 2.938 | |
| MA50: | 3.022 | |
| MA100: | 2.914 | |
| MAexp7: | 2.941 | |
| MAexp20: | 2.900 | |
| MAexp50: | 2.622 | |
| MAexp100: | 2.291 | |
| Price / MA7: | -1.41% | |
| Price / MA20: | -4.70% | |
| Price / MA50: | -7.35% | |
| Price / MA100: | -3.91% | |
| Price / MAexp7: | -4.79% | |
| Price / MAexp20: | -3.45% | |
| Price / MAexp50: | +6.79% | |
| Price / MAexp100: | +22.22% |
About author

Online


Add a comment
Comments
0 comments on the analysis RPMGLOBAL HOLDINGS LIMITED - Weekly