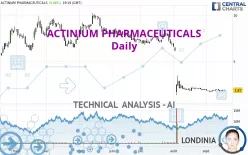
ACTINIUM PHARMACEUTICALS - Daily - Technical analysis published on 09/19/2024 (GMT)
- 157
- 0
Click here for a new analysis!
- Timeframe : Daily
- - Analysis generated on
- Status : TARGET REACHED

Summary of the analysis

Additional analysis
Quotes
The ACTINIUM PHARMACEUTICALS price is 1.87 USD. On the day, this instrument gained +5.06% and was traded between 1.82 USD and 1.91 USD over the period. The price is currently at +2.75% from its lowest and -2.09% from its highest.A bullish opening was detected by the Central Gaps scanner. Buyers are trying to impose a bullish momentum in the very short term.
Bullish opening
Type : Bullish
Timeframe : Openning
A study of price movements over other periods shows the following variations:
Abnormal volumes
Timeframe : 50 days
Technical
Technical analysis of ACTINIUM PHARMACEUTICALS in Daily shows a overall strongly bearish trend. The signals given by moving averages are 92.86% bearish. This strong bearish trend is confirmed by the strong signals currently being given by short-term moving averages. The Central Indicators market scanner is currently detecting a bullish signal that could impact this trend:
Bullish price crossover with Moving Average 20
Type : Bullish
Timeframe : Daily
The probability of a further increase is slight given the direction of the technical indicators.
Central Indicators, the detector scanner for these technical indicators has recently detected several signals:
Pivot points : price is over resistance 1
Type : Neutral
Timeframe : Daily
Aroon indicator bullish trend
Type : Bullish
Timeframe : Daily
Price is back over the pivot point
Type : Bullish
Timeframe : Weekly
Momentum indicator is back over 0
Type : Bullish
Timeframe : Daily
Williams %R indicator is back over -50
Type : Bullish
Timeframe : Daily
No signals are given by Central Patterns, a market scanner specialised in chart patterns, resistances and supports.
No result was found by the Central Candlesticks scanner on Japanese candlesticks.
| S1 | Price | R1 | R2 | R3 | |
|---|---|---|---|---|---|
| ProTrendLines | 1.75 | 1.87 | 4.62 | 7.07 | 8.01 |
| Change (%) | -6.42% | - | +147.06% | +278.07% | +328.34% |
| Change | -0.12 | - | +2.75 | +5.20 | +6.14 |
| Level | Major | - | Intermediate | Intermediate | Intermediate |
To determine price objectives, it is also possible to use the pivot points. Here is the price position in relation to pivot points:
| Pivot points | S3 | S2 | S1 | PP | R1 | R2 | R3 |
|---|---|---|---|---|---|---|---|
| Standard | 1.59 | 1.69 | 1.73 | 1.83 | 1.87 | 1.97 | 2.01 |
| Camarilla | 1.74 | 1.75 | 1.77 | 1.78 | 1.79 | 1.81 | 1.82 |
| Woodie | 1.57 | 1.68 | 1.71 | 1.82 | 1.85 | 1.96 | 1.99 |
| Fibonacci | 1.69 | 1.74 | 1.77 | 1.83 | 1.88 | 1.91 | 1.97 |
| Pivot points | S3 | S2 | S1 | PP | R1 | R2 | R3 |
|---|---|---|---|---|---|---|---|
| Standard | 1.48 | 1.61 | 1.74 | 1.87 | 2.00 | 2.13 | 2.26 |
| Camarilla | 1.79 | 1.81 | 1.84 | 1.86 | 1.88 | 1.91 | 1.93 |
| Woodie | 1.47 | 1.61 | 1.73 | 1.87 | 1.99 | 2.13 | 2.25 |
| Fibonacci | 1.61 | 1.71 | 1.77 | 1.87 | 1.97 | 2.03 | 2.13 |
| Pivot points | S3 | S2 | S1 | PP | R1 | R2 | R3 |
|---|---|---|---|---|---|---|---|
| Standard | -5.80 | -2.24 | -0.12 | 3.44 | 5.56 | 9.12 | 11.24 |
| Camarilla | 0.43 | 0.95 | 1.47 | 1.99 | 2.51 | 3.03 | 3.55 |
| Woodie | -6.53 | -2.60 | -0.85 | 3.08 | 4.83 | 8.76 | 10.51 |
| Fibonacci | -2.24 | -0.07 | 1.27 | 3.44 | 5.61 | 6.95 | 9.12 |
Numerical data
The following are the details of the technical indicators and moving averages that were collected to generate this technical analysis:
| RSI (14): | 35.04 | |
| MACD (12,26,9): | -0.4500 | |
| Directional Movement: | -16.08 | |
| AROON (14): | 35.72 | |
| DEMA (21): | 1.36 | |
| Parabolic SAR (0,02-0,02-0,2): | 1.58 | |
| Elder Ray (13): | -0.03 | |
| Super Trend (3,10): | 2.40 | |
| Zig ZAG (10): | 1.90 | |
| VORTEX (21): | 0.8900 | |
| Stochastique (14,3,5): | 44.78 | |
| TEMA (21): | 1.74 | |
| Williams %R (14): | -33.33 | |
| Chande Momentum Oscillator (20): | 0.03 | |
| Repulse (5,40,3): | -3.1300 | |
| ROCnROLL: | -1 | |
| TRIX (15,9): | -2.9900 | |
| Courbe Coppock: | 11.00 |
| MA7: | 1.86 | |
| MA20: | 1.89 | |
| MA50: | 3.81 | |
| MA100: | 5.97 | |
| MAexp7: | 1.85 | |
| MAexp20: | 2.09 | |
| MAexp50: | 3.43 | |
| MAexp100: | 4.83 | |
| Price / MA7: | +0.54% | |
| Price / MA20: | -1.06% | |
| Price / MA50: | -50.92% | |
| Price / MA100: | -68.68% | |
| Price / MAexp7: | +1.08% | |
| Price / MAexp20: | -10.53% | |
| Price / MAexp50: | -45.48% | |
| Price / MAexp100: | -61.28% |
News
The last news published on ACTINIUM PHARMACEUTICALS at the time of the generation of this analysis was as follows:
- SHAREHOLDER ALERT: Pomerantz Law Firm Investigates Claims On Behalf of Investors of Actinium Pharmaceuticals, Inc. - ATNM
- SHAREHOLDER ALERT: Pomerantz Law Firm Investigates Claims On Behalf of Investors of Actinium Pharmaceuticals, Inc. - ATNM
- SHAREHOLDER ALERT: Pomerantz Law Firm Investigates Claims On Behalf of Investors of Actinium Pharmaceuticals, Inc. - ATNM
- SHAREHOLDER ALERT: Pomerantz Law Firm Investigates Claims On Behalf of Investors of Actinium Pharmaceuticals, Inc. - ATNM
- SHAREHOLDER ALERT: Pomerantz Law Firm Investigates Claims On Behalf of Investors of Actinium Pharmaceuticals, Inc. - ATNM
About author
Online


Add a comment
Comments
0 comments on the analysis ACTINIUM PHARMACEUTICALS - Daily