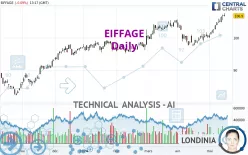
EIFFAGE - Daily - Technical analysis published on 05/16/2024 (GMT)
- 150
- 0
Click here for a new analysis!
- Timeframe : Daily
- - Analysis generated on
- Status : INVALID

Summary of the analysis

Additional analysis
Quotes
The EIFFAGE rating is 106.90 EUR. The price is lower by -0.09% since the last closing with the lowest point at 106.65 EUR and the highest point at 107.75 EUR. The deviation from the price is +0.23% for the low point and -0.79% for the high point.Here is a more detailed summary of the historical variations registered by EIFFAGE:
New HIGH record (5 years)
Type : Bullish
Timeframe : Weekly
New HIGH record (1 year)
Type : Bullish
Timeframe : Weekly
New HIGH record (1st january)
Type : Bullish
Timeframe : Weekly
New HIGH record (1 month)
Type : Bullish
Timeframe : Weekly
Technical
Technical analysis of EIFFAGE in Daily shows a strongly overall bullish trend. The signals given by the moving averages are 92.86% bullish. This strong bullish trend is confirmed by the strong signals currently being given by short-term moving averages. The Central Indicators market scanner is currently detecting a bullish signal that could impact this trend:
Moving Average bullish crossovers : MA20 & MA50
Type : Bullish
Timeframe : Daily
Technical indicators are strongly bullish, suggesting that the price increase should continue.
But beware of excesses. The Central Indicators scanner currently detects this:
RSI indicator is overbought : over 70
Type : Neutral
Timeframe : Daily
CCI indicator is overbought : over 100
Type : Neutral
Timeframe : Daily
Williams %R indicator is overbought : over -20
Type : Neutral
Timeframe : Daily
Pivot points : price is over resistance 1
Type : Neutral
Timeframe : Weekly
An analysis of the price chart with the Central Patterns scanner (detector of chart patterns and resistances and supports) shows a result that can have an impact on the price change:
Near resistance of channel
Type : Bearish
Timeframe : Daily
Central Candlesticks, the scanner specialised in Japanese candlesticks, detects this inversion signal that could impact the current short-term trend:
Doji
Type : Neutral
Timeframe : Daily
| S3 | S2 | S1 | Price | |
|---|---|---|---|---|
| ProTrendLines | 91.98 | 97.80 | 104.24 | 106.90 |
| Change (%) | -13.96% | -8.51% | -2.49% | - |
| Change | -14.92 | -9.10 | -2.66 | - |
| Level | Major | Major | Major | - |
To determine price objectives, it is also possible to use the pivot points. Here is the price position in relation to pivot points:
| Pivot points | S3 | S2 | S1 | PP | R1 | R2 | R3 |
|---|---|---|---|---|---|---|---|
| Standard | 104.10 | 104.80 | 105.90 | 106.60 | 107.70 | 108.40 | 109.50 |
| Camarilla | 106.51 | 106.67 | 106.84 | 107.00 | 107.17 | 107.33 | 107.50 |
| Woodie | 104.30 | 104.90 | 106.10 | 106.70 | 107.90 | 108.50 | 109.70 |
| Fibonacci | 104.80 | 105.49 | 105.91 | 106.60 | 107.29 | 107.71 | 108.40 |
| Pivot points | S3 | S2 | S1 | PP | R1 | R2 | R3 |
|---|---|---|---|---|---|---|---|
| Standard | 97.75 | 99.60 | 102.30 | 104.15 | 106.85 | 108.70 | 111.40 |
| Camarilla | 103.75 | 104.17 | 104.58 | 105.00 | 105.42 | 105.83 | 106.25 |
| Woodie | 98.18 | 99.81 | 102.73 | 104.36 | 107.28 | 108.91 | 111.83 |
| Fibonacci | 99.60 | 101.34 | 102.41 | 104.15 | 105.89 | 106.96 | 108.70 |
| Pivot points | S3 | S2 | S1 | PP | R1 | R2 | R3 |
|---|---|---|---|---|---|---|---|
| Standard | 88.17 | 92.77 | 96.54 | 101.14 | 104.91 | 109.51 | 113.28 |
| Camarilla | 98.00 | 98.77 | 99.53 | 100.30 | 101.07 | 101.84 | 102.60 |
| Woodie | 87.75 | 92.56 | 96.12 | 100.93 | 104.49 | 109.30 | 112.86 |
| Fibonacci | 92.77 | 95.97 | 97.95 | 101.14 | 104.34 | 106.32 | 109.51 |
Numerical data
The following is the status of the technical indicators and moving averages at the time of publication of this technical analysis:
| RSI (14): | 75.93 | |
| MACD (12,26,9): | 1.5700 | |
| Directional Movement: | 26.02 | |
| AROON (14): | 100.00 | |
| DEMA (21): | 105.05 | |
| Parabolic SAR (0,02-0,02-0,2): | 104.53 | |
| Elder Ray (13): | 2.95 | |
| Super Trend (3,10): | 103.12 | |
| Zig ZAG (10): | 107.10 | |
| VORTEX (21): | 1.2800 | |
| Stochastique (14,3,5): | 94.98 | |
| TEMA (21): | 106.31 | |
| Williams %R (14): | -8.34 | |
| Chande Momentum Oscillator (20): | 6.50 | |
| Repulse (5,40,3): | 1.3100 | |
| ROCnROLL: | 1 | |
| TRIX (15,9): | 0.1100 | |
| Courbe Coppock: | 11.52 |
| MA7: | 105.60 | |
| MA20: | 102.32 | |
| MA50: | 102.20 | |
| MA100: | 99.78 | |
| MAexp7: | 105.53 | |
| MAexp20: | 103.34 | |
| MAexp50: | 101.66 | |
| MAexp100: | 99.75 | |
| Price / MA7: | +1.23% | |
| Price / MA20: | +4.48% | |
| Price / MA50: | +4.60% | |
| Price / MA100: | +7.14% | |
| Price / MAexp7: | +1.30% | |
| Price / MAexp20: | +3.44% | |
| Price / MAexp50: | +5.15% | |
| Price / MAexp100: | +7.17% |
About author
Online


Add a comment
Comments
0 comments on the analysis EIFFAGE - Daily