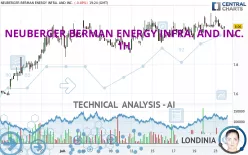
NEUBERGER BERMAN ENERGY INFRA. AND INC. - 1H - Technical analysis published on 07/23/2024 (GMT)
- 181
- 0
Click here for a new analysis!
- Timeframe : 1H
- - Analysis generated on
- Status : INVALID

Summary of the analysis

Additional analysis
Quotes
The NEUBERGER BERMAN ENERGY INFRA. AND INC. rating is 8.05 USD. The price registered a decrease of -0.62% on the session and was traded between 8.04 USD and 8.13 USD over the period. The price is currently at +0.12% from its lowest and -0.98% from its highest.The Central Gaps scanner detects a bearish opening. A small advantage for sellers in the very short term.
Bearish opening
Type : Bearish
Timeframe : Openning
So that you have an overall view of the price change, here is a table showing the variations over several periods:
New HIGH record (5 years)
Type : Bullish
Timeframe : Weekly
Near a new HIGH record (1 year)
Type : Bullish
Timeframe : Weekly
Near a new HIGH record (1st january)
Type : Bullish
Timeframe : Weekly
Near a new HIGH record (1 month)
Type : Bullish
Timeframe : Weekly
Technical
Technical analysis of this 1H chart of NEUBERGER BERMAN ENERGY INFRA. AND INC. indicates that the overall trend is bullish. 75.00% of the signals given by moving averages are bullish. Caution: the neutral signals currently given by short-term moving averages show us that the global trend is losing momentum. There is no crossing of moving average by the price or crossing of moving averages between themselves.
An assessment of technical indicators does not currently provide any relevant information to suggest whether the signal given by the technical indicators is more bullish or bearish.
Central Indicators, the detector scanner for these technical indicators has recently detected several signals:
Pivot points : price is under support 1
Type : Neutral
Timeframe : 1 hour
Momentum indicator is back under 0
Type : Bearish
Timeframe : 1 hour
An analysis of the price chart with the Central Patterns scanner (detector of chart patterns and resistances and supports) shows several results that can have an impact on the price change:
Near support of channel
Type : Bullish
Timeframe : 1 hour
Near support of triangle
Type : Bullish
Timeframe : 1 hour
The Central Candlesticks scanner which studies Japanese candlesticks did not detect anything.
| S3 | S2 | S1 | Price | R1 | R2 | R3 | |
|---|---|---|---|---|---|---|---|
| ProTrendLines | 7.69 | 7.85 | 7.99 | 8.05 | 8.09 | 9.70 | 16.02 |
| Change (%) | -4.47% | -2.48% | -0.75% | - | +0.50% | +20.50% | +99.01% |
| Change | -0.36 | -0.20 | -0.06 | - | +0.04 | +1.65 | +7.97 |
| Level | Minor | Minor | Major | - | Intermediate | Minor | Intermediate |
Pivot points can also be used to set your price objectives. Here is the price situation in relation to pivot points:
| Pivot points | S3 | S2 | S1 | PP | R1 | R2 | R3 |
|---|---|---|---|---|---|---|---|
| Standard | 7.95 | 8.00 | 8.05 | 8.10 | 8.15 | 8.20 | 8.25 |
| Camarilla | 8.07 | 8.08 | 8.09 | 8.10 | 8.11 | 8.12 | 8.13 |
| Woodie | 7.95 | 8.00 | 8.05 | 8.10 | 8.15 | 8.20 | 8.25 |
| Fibonacci | 8.00 | 8.04 | 8.06 | 8.10 | 8.14 | 8.16 | 8.20 |
| Pivot points | S3 | S2 | S1 | PP | R1 | R2 | R3 |
|---|---|---|---|---|---|---|---|
| Standard | 7.81 | 7.88 | 7.96 | 8.03 | 8.11 | 8.18 | 8.26 |
| Camarilla | 8.00 | 8.01 | 8.03 | 8.04 | 8.05 | 8.07 | 8.08 |
| Woodie | 7.82 | 7.88 | 7.97 | 8.03 | 8.12 | 8.18 | 8.27 |
| Fibonacci | 7.88 | 7.94 | 7.97 | 8.03 | 8.09 | 8.12 | 8.18 |
| Pivot points | S3 | S2 | S1 | PP | R1 | R2 | R3 |
|---|---|---|---|---|---|---|---|
| Standard | 6.94 | 7.17 | 7.56 | 7.79 | 8.18 | 8.41 | 8.80 |
| Camarilla | 7.78 | 7.84 | 7.89 | 7.95 | 8.01 | 8.06 | 8.12 |
| Woodie | 7.02 | 7.21 | 7.64 | 7.83 | 8.26 | 8.45 | 8.88 |
| Fibonacci | 7.17 | 7.41 | 7.55 | 7.79 | 8.03 | 8.17 | 8.41 |
Numerical data
The following is the status of the technical indicators and moving averages at the time of publication of this technical analysis:
| RSI (14): | 47.87 | |
| MACD (12,26,9): | 0.0100 | |
| Directional Movement: | 15.03 | |
| AROON (14): | 42.86 | |
| DEMA (21): | 8.07 | |
| Parabolic SAR (0,02-0,02-0,2): | 8.15 | |
| Elder Ray (13): | -0.02 | |
| Super Trend (3,10): | 7.96 | |
| Zig ZAG (10): | 8.04 | |
| VORTEX (21): | 1.0200 | |
| Stochastique (14,3,5): | 29.76 | |
| TEMA (21): | 8.07 | |
| Williams %R (14): | -75.00 | |
| Chande Momentum Oscillator (20): | -0.04 | |
| Repulse (5,40,3): | -0.5800 | |
| ROCnROLL: | -1 | |
| TRIX (15,9): | 0.0200 | |
| Courbe Coppock: | 0.42 |
| MA7: | 8.04 | |
| MA20: | 7.96 | |
| MA50: | 7.73 | |
| MA100: | 7.40 | |
| MAexp7: | 8.06 | |
| MAexp20: | 8.06 | |
| MAexp50: | 8.03 | |
| MAexp100: | 7.97 | |
| Price / MA7: | +0.12% | |
| Price / MA20: | +1.13% | |
| Price / MA50: | +4.14% | |
| Price / MA100: | +8.78% | |
| Price / MAexp7: | -0.12% | |
| Price / MAexp20: | -0.12% | |
| Price / MAexp50: | +0.25% | |
| Price / MAexp100: | +1.00% |
News
The last news published on NEUBERGER BERMAN ENERGY INFRA. AND INC. at the time of the generation of this analysis was as follows:
- Neuberger Berman MLP Income Fund Announces Portfolio Manager Update Call Thursday, November 29, 2018
- Neuberger Berman MLP Income Fund Announces Monthly Distributions
- Neuberger Berman MLP Income Fund Announces Monthly Distributions
- Neuberger Berman MLP Income Fund To Provide Fund Update Thursday, May 10, 2018
- Neuberger Berman MLP Income Fund Announces Monthly Distributions
About author
Online


Add a comment
Comments
0 comments on the analysis NEUBERGER BERMAN ENERGY INFRA. AND INC. - 1H