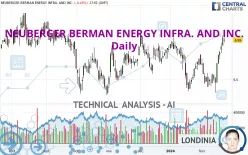
NEUBERGER BERMAN ENERGY INFRA. AND INC. - Daily - Technical analysis published on 02/23/2024 (GMT)
- 255
- 0
Click here for a new analysis!
- Timeframe : Daily
- - Analysis generated on
- Status : LEVEL MAINTAINED

Summary of the analysis

Additional analysis
Quotes
The NEUBERGER BERMAN ENERGY INFRA. AND INC. rating is 6.99 USD. On the day, this instrument lost -0.43% and was between 6.96 USD and 7.02 USD. This implies that the price is at +0.43% from its lowest and at -0.43% from its highest.A bearish opening was detected by the Central Gaps scanner. Sellers are trying to impose a bearish trend in the very short term.
Bearish opening
Type : Bearish
Timeframe : Openning
A study of price movements over other periods shows the following variations:
Near a new HIGH record (1 year)
Type : Bullish
Timeframe : Weekly
Near a new HIGH record (1st january)
Type : Bullish
Timeframe : Weekly
Near a new HIGH record (1 month)
Type : Bullish
Timeframe : Weekly
Technical
A technical analysis in Daily of this NEUBERGER BERMAN ENERGY INFRA. AND INC. chart shows a strongly bullish trend. 89.29% of the signals given by moving averages are bullish. This strongly bullish trend is supported by the strong bullish signals given by short-term moving averages. The Central Indicators scanner does not detect any result on moving averages that would impact this trend.
In fact, 15 technical indicators on 18 studied are currently positioned bullish. But beware of excesses. The Central Indicators scanner currently detects this:
CCI indicator is overbought : over 100
Type : Neutral
Timeframe : Daily
Williams %R indicator is overbought : over -20
Type : Neutral
Timeframe : Daily
Pivot points : price is over resistance 1
Type : Neutral
Timeframe : Weekly
Price is back over the pivot point
Type : Bullish
Timeframe : Daily
The Central Patterns scanner, which studies chart patterns, resistances and supports, has identified these signals:
Near horizontal resistance
Type : Bearish
Timeframe : Daily
Resistance of channel is broken
Type : Bullish
Timeframe : Daily
The Central Candlesticks scanner, specialised in Japanese candlesticks, did not identify any signals.
| S3 | S2 | S1 | Price | R1 | R2 | R3 | |
|---|---|---|---|---|---|---|---|
| ProTrendLines | 6.15 | 6.35 | 6.70 | 6.99 | 7.04 | 10.08 | 16.65 |
| Change (%) | -12.02% | -9.16% | -4.15% | - | +0.72% | +44.21% | +138.20% |
| Change | -0.84 | -0.64 | -0.29 | - | +0.05 | +3.09 | +9.66 |
| Level | Major | Major | Intermediate | - | Major | Minor | Minor |
To determine price objectives, it is also possible to use the pivot points. Here is the price position in relation to pivot points:
| Pivot points | S3 | S2 | S1 | PP | R1 | R2 | R3 |
|---|---|---|---|---|---|---|---|
| Standard | 6.81 | 6.87 | 6.94 | 7.00 | 7.07 | 7.13 | 7.20 |
| Camarilla | 6.98 | 7.00 | 7.01 | 7.02 | 7.03 | 7.04 | 7.06 |
| Woodie | 6.83 | 6.87 | 6.96 | 7.00 | 7.09 | 7.13 | 7.22 |
| Fibonacci | 6.87 | 6.92 | 6.95 | 7.00 | 7.05 | 7.08 | 7.13 |
| Pivot points | S3 | S2 | S1 | PP | R1 | R2 | R3 |
|---|---|---|---|---|---|---|---|
| Standard | 6.00 | 6.17 | 6.48 | 6.65 | 6.96 | 7.13 | 7.44 |
| Camarilla | 6.67 | 6.71 | 6.76 | 6.80 | 6.84 | 6.89 | 6.93 |
| Woodie | 6.08 | 6.21 | 6.56 | 6.69 | 7.04 | 7.17 | 7.52 |
| Fibonacci | 6.17 | 6.35 | 6.46 | 6.65 | 6.83 | 6.94 | 7.13 |
| Pivot points | S3 | S2 | S1 | PP | R1 | R2 | R3 |
|---|---|---|---|---|---|---|---|
| Standard | 5.72 | 6.00 | 6.32 | 6.60 | 6.92 | 7.20 | 7.52 |
| Camarilla | 6.47 | 6.52 | 6.58 | 6.63 | 6.69 | 6.74 | 6.80 |
| Woodie | 5.73 | 6.01 | 6.33 | 6.61 | 6.93 | 7.21 | 7.53 |
| Fibonacci | 6.00 | 6.23 | 6.37 | 6.60 | 6.83 | 6.97 | 7.20 |
Numerical data
The following is the status of technical indicators and moving averages registered at the time this technical analysis was created:
| RSI (14): | 67.19 | |
| MACD (12,26,9): | 0.0900 | |
| Directional Movement: | 16.79 | |
| AROON (14): | 35.72 | |
| DEMA (21): | 6.77 | |
| Parabolic SAR (0,02-0,02-0,2): | 6.49 | |
| Elder Ray (13): | 0.25 | |
| Super Trend (3,10): | 6.62 | |
| Zig ZAG (10): | 7.00 | |
| VORTEX (21): | 1.1800 | |
| Stochastique (14,3,5): | 93.77 | |
| TEMA (21): | 6.86 | |
| Williams %R (14): | -6.94 | |
| Chande Momentum Oscillator (20): | 0.54 | |
| Repulse (5,40,3): | 2.9900 | |
| ROCnROLL: | 1 | |
| TRIX (15,9): | 0.0300 | |
| Courbe Coppock: | 8.51 |
| MA7: | 6.82 | |
| MA20: | 6.62 | |
| MA50: | 6.63 | |
| MA100: | 6.54 | |
| MAexp7: | 6.84 | |
| MAexp20: | 6.68 | |
| MAexp50: | 6.62 | |
| MAexp100: | 6.59 | |
| Price / MA7: | +2.49% | |
| Price / MA20: | +5.59% | |
| Price / MA50: | +5.43% | |
| Price / MA100: | +6.88% | |
| Price / MAexp7: | +2.19% | |
| Price / MAexp20: | +4.64% | |
| Price / MAexp50: | +5.59% | |
| Price / MAexp100: | +6.07% |
News
Don't forget to follow the news on NEUBERGER BERMAN ENERGY INFRA. AND INC.. At the time of publication of this analysis, the latest news was as follows:
- Neuberger Berman MLP Income Fund Announces Portfolio Manager Update Call Thursday, November 29, 2018
- Neuberger Berman MLP Income Fund Announces Monthly Distributions
- Neuberger Berman MLP Income Fund Announces Monthly Distributions
- Neuberger Berman MLP Income Fund To Provide Fund Update Thursday, May 10, 2018
- Neuberger Berman MLP Income Fund Announces Monthly Distributions
About author
Online


Add a comment
Comments
0 comments on the analysis NEUBERGER BERMAN ENERGY INFRA. AND INC. - Daily