NATIONAL HEALTHCARE - Daily - Technical analysis published on 01/28/2020 (GMT)
- 280
- 0
- Who voted?
- Timeframe : Daily
- - Analysis generated on
- Status : NEUTRAL
Summary of the analysis

Additional analysis
Quotes
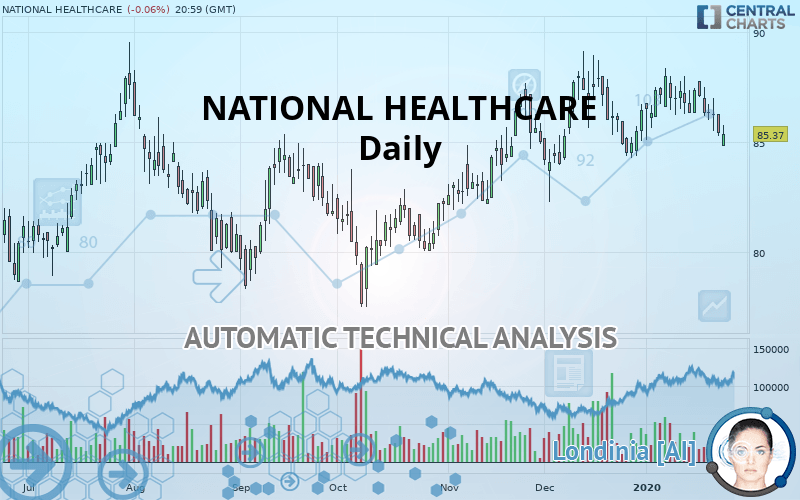
NATIONAL HEALTHCARE rating 85.37 USD. The price is lower by -0.06% since the last closing with the lowest point at 84.81 USD and the highest point at 85.75 USD. The deviation from the price is +0.66% for the low point and -0.44% for the high point.A bearish gap was detected at the opening by the Central Gaps scanner. There are a lot of sellers and they have the upper hand in the very short term.
Opening Gap DOWN
Type : Bearish
Timeframe : Openning
Here is a more detailed summary of the historical variations registered by NATIONAL HEALTHCARE:
Near a new HIGH record (5 years)
Type : Bullish
Timeframe : Weekly
Near a new HIGH record (1 year)
Type : Bullish
Timeframe : Weekly
Near a new HIGH record (1st january)
Type : Bullish
Timeframe : Weekly
Near a new HIGH record (1 month)
Type : Bullish
Timeframe : Weekly
Technical
Technical analysis of this Daily chart of NATIONAL HEALTHCARE indicates that the overall trend is slightly bullish. 60.71% of the signals given by moving averages are bullish. Caution: the slightly bearish signals currently given by short-term moving averages indicate that this slightly bullish trend could be reversed. The Central Indicators market scanner is currently detecting several bearish signals that could impact this trend:
Bearish trend reversal : adaptative moving average 50
Type : Bearish
Timeframe : Daily
Bearish price crossover with Moving Average 50
Type : Bearish
Timeframe : Daily
Bearish price crossover with adaptative moving average 20
Type : Bearish
Timeframe : Daily
An assessment of technical indicators does not currently provide any relevant information to suggest whether the signal given by the technical indicators is more bullish or bearish.
Caution: the Central Indicators scanner currently detects an excess:
Williams %R indicator is oversold : under -80
Type : Neutral
Timeframe : Daily
Aroon indicator bearish trend
Type : Bearish
Timeframe : Daily
Price is back under the pivot point
Type : Bearish
Timeframe : Daily
Price is back under the pivot point
Type : Bearish
Timeframe : Weekly
Central Patterns, the market scanner focusing on chart patterns, resistances and supports found these results:
Near horizontal support
Type : Bullish
Timeframe : Daily
Support of channel is broken
Type : Bearish
Timeframe : Daily
Support of triangle is broken
Type : Bearish
Timeframe : Daily
The presence of a bearish pattern in Japanese candlesticks detected by Central Candlesticks that could cause a correction in the very short term was also detected:
Bearish engulfing lines
Type : Bearish
Timeframe : Daily
| S3 | S2 | S1 | Price | R1 | |
|---|---|---|---|---|---|
| ProTrendLines | 80.09 | 82.25 | 84.03 | 85.37 | 87.92 |
| Change (%) | -6.18% | -3.65% | -1.57% | - | +2.99% |
| Change | -5.28 | -3.12 | -1.34 | - | +2.55 |
| Level | Intermediate | Minor | Major | - | Major |
To determine price objectives, it is also possible to use the pivot points. Here is the price position in relation to pivot points:
| Pivot points | S3 | S2 | S1 | PP | R1 | R2 | R3 |
|---|---|---|---|---|---|---|---|
| Standard | 83.99 | 84.62 | 85.02 | 85.65 | 86.05 | 86.68 | 87.08 |
| Camarilla | 85.14 | 85.23 | 85.33 | 85.42 | 85.51 | 85.61 | 85.70 |
| Woodie | 83.88 | 84.56 | 84.91 | 85.59 | 85.94 | 86.62 | 86.97 |
| Fibonacci | 84.62 | 85.01 | 85.26 | 85.65 | 86.04 | 86.29 | 86.68 |
| Pivot points | S3 | S2 | S1 | PP | R1 | R2 | R3 |
|---|---|---|---|---|---|---|---|
| Standard | 82.36 | 83.81 | 84.61 | 86.06 | 86.86 | 88.31 | 89.11 |
| Camarilla | 84.80 | 85.01 | 85.21 | 85.42 | 85.63 | 85.83 | 86.04 |
| Woodie | 82.05 | 83.65 | 84.30 | 85.90 | 86.55 | 88.15 | 88.80 |
| Fibonacci | 83.81 | 84.67 | 85.20 | 86.06 | 86.92 | 87.45 | 88.31 |
| Pivot points | S3 | S2 | S1 | PP | R1 | R2 | R3 |
|---|---|---|---|---|---|---|---|
| Standard | 75.87 | 79.06 | 82.74 | 85.93 | 89.61 | 92.80 | 96.48 |
| Camarilla | 84.54 | 85.17 | 85.80 | 86.43 | 87.06 | 87.69 | 88.32 |
| Woodie | 76.13 | 79.18 | 83.00 | 86.05 | 89.87 | 92.92 | 96.74 |
| Fibonacci | 79.06 | 81.68 | 83.30 | 85.93 | 88.55 | 90.17 | 92.80 |
Numerical data
The following are the details of the technical indicators and moving averages that were collected to generate this technical analysis:
| RSI (14): | 43.10 | |
| MACD (12,26,9): | 0.0100 | |
| Directional Movement: | -6.37 | |
| AROON (14): | -85.71 | |
| DEMA (21): | 86.49 | |
| Parabolic SAR (0,02-0,02-0,2): | 88.17 | |
| Elder Ray (13): | -1.02 | |
| Super Trend (3,10): | 83.79 | |
| Zig ZAG (10): | 85.37 | |
| VORTEX (21): | 1.0000 | |
| Stochastique (14,3,5): | 15.90 | |
| TEMA (21): | 86.05 | |
| Williams %R (14): | -84.18 | |
| Chande Momentum Oscillator (20): | -2.62 | |
| Repulse (5,40,3): | -0.5900 | |
| ROCnROLL: | 2 | |
| TRIX (15,9): | 0.0400 | |
| Courbe Coppock: | 0.70 |
| MA7: | 86.30 | |
| MA20: | 86.53 | |
| MA50: | 86.00 | |
| MA100: | 83.90 | |
| MAexp7: | 86.06 | |
| MAexp20: | 86.34 | |
| MAexp50: | 85.67 | |
| MAexp100: | 84.43 | |
| Price / MA7: | -1.08% | |
| Price / MA20: | -1.34% | |
| Price / MA50: | -0.73% | |
| Price / MA100: | +1.75% | |
| Price / MAexp7: | -0.80% | |
| Price / MAexp20: | -1.12% | |
| Price / MAexp50: | -0.35% | |
| Price / MAexp100: | +1.11% |
News
The last news published on NATIONAL HEALTHCARE at the time of the generation of this analysis was as follows:
- Leidos to Provide Support Services for the CDC's National Healthcare Safety Network
- NHC Reports 2018 Year End Earnings
- NHC Announces Common Dividend
- National HealthCare Corporation Partners with MatrixCare for Enterprise Technology Solution
- Chambers USA Recognizes 37 Waller Attorneys; Cites National Healthcare Status
About author

Online


Add a comment
Comments
0 comments on the analysis NATIONAL HEALTHCARE - Daily