NATIONAL HEALTHCARE - Daily - Technical analysis published on 09/13/2023 (GMT)
- 144
- 0
Oops, I was wrong about that analysis. My threshold for invalidation has been broken.
Click here for a new analysis!
Click here for a new analysis!
- Timeframe : Daily
- - Analysis generated on
- Status : INVALID
Summary of the analysis
Trends
Short term:
Bullish
Underlying:
Strongly bullish
Technical indicators
50%
17%
33%
My opinion
Bullish above 65.03 USD
My targets
72.80 USD (+7.92%)
78.19 USD (+15.91%)
My analysis
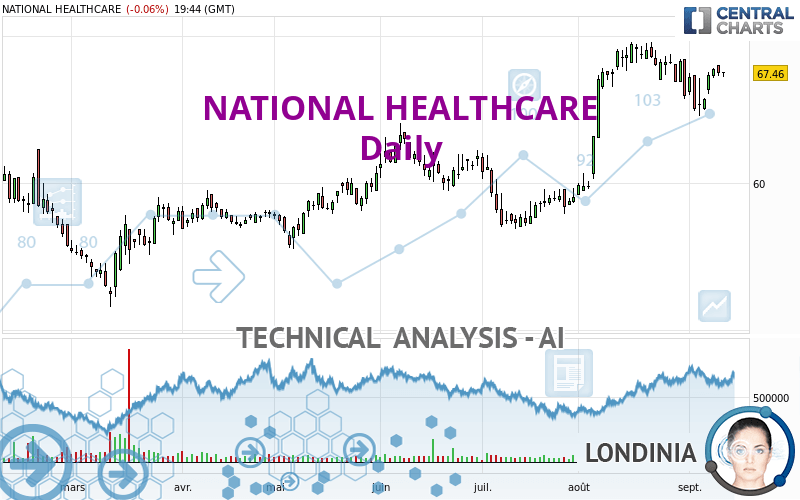
All elements being clearly bullish, it would be possible for traders to trade only long positions (at the time of purchase) on NATIONAL HEALTHCARE as long as the price remains well above 65.03 USD. The buyers' bullish objective is set at 72.80 USD. A bullish break in this resistance would boost the bullish momentum. The buyers could then target the resistance located at 78.19 USD. If there is any crossing, the next objective would be the resistance located at 87.13 USD. Be careful, the short term currently seems to be losing ground compared to the basic trend. Longer time units should be analysed to identify possible overbought items that could be a sign of a possible short-term correction.
Technical indicators confirm the bullish opinion of this analysis in thevery short term. However, be careful of excessive bullish movements. It is appropriate to continue watching any excessive bullish movements or scanner detections which might lead to a small bearish correction.
Force
0
10
5.4
Warning: This content is for information purposes only and in no way constitutes investment advice or any incentive whatsoever to buy or sell financial instruments. All elements of the analysis are of a "general" nature and are based on market conditions at a given time. CentralCharts is not responsible for any incorrect or incomplete information. Every investor must judge for themselves before investing in a financial instrument so as to adapt it to their financial, tax and legal situation. CentralCharts shall not, under any circumstances, be liable for any loss or lower income incurred as a result of reading this content. Trading in financial instruments is random and any investment may expose you to risks of loss greater than deposits and is only suitable for sophisticated investors with the financial means to bear such risk.

This analysis was given by Londinia. Take part yourself by sharing additional analysis on another time unit:
Additional analysis
Quotes
The NATIONAL HEALTHCARE rating is 67.46 USD. The price registered a decrease of -0.06% on the session with the lowest point at 67.22 USD and the highest point at 67.57 USD. The deviation from the price is +0.36% for the low point and -0.16% for the high point.67.22
67.57
67.46
So that you have an overall view of the price change, here is a table showing the variations over several periods:
Near a new HIGH record (1 year)
Type : Bullish
Timeframe : Weekly
Near a new HIGH record (1st january)
Type : Bullish
Timeframe : Weekly
Near a new LOW record (1 month)
Type : Bearish
Timeframe : Weekly
Technical
A technical analysis in Daily of this NATIONAL HEALTHCARE chart shows a strongly bullish trend. The signals given by moving averages are 82.14% bullish. This strongly bullish trend seems to be running out of steam given the signals being given by short-term moving averages. There is no crossing of moving average by the price or crossing of moving averages between themselves.
In fact, only 9 technical indicators out of 18 studied are currently positioned bullish. Central Indicators, the scanner specialised in technical indicators, has identified this signal:
Ichimoku - Bearish crossover : Tenkan & Kijun
Type : Bearish
Timeframe : Daily
No signals are given by Central Patterns, a market scanner specialised in chart patterns, resistances and supports.
Central Candlesticks, the scanner specialised in Japanese candlesticks, detects this inversion signal that could impact the current short-term trend:
Black hanging man / hammer
Type : Neutral
Timeframe : Daily
ProTrendLines
S3
S2
S1
R1
R2
R3
Price
| S3 | S2 | S1 | Price | R1 | R2 | R3 | |
|---|---|---|---|---|---|---|---|
| ProTrendLines | 57.17 | 62.48 | 65.03 | 67.46 | 68.43 | 72.80 | 78.19 |
| Change (%) | -15.25% | -7.38% | -3.60% | - | +1.44% | +7.92% | +15.91% |
| Change | -10.29 | -4.98 | -2.43 | - | +0.97 | +5.34 | +10.73 |
| Level | Major | Major | Major | - | Major | Intermediate | Major |
Attention could also be paid to pivot points to set price objectives:
Daily
| Pivot points | S3 | S2 | S1 | PP | R1 | R2 | R3 |
|---|---|---|---|---|---|---|---|
| Standard | 66.46 | 66.87 | 67.19 | 67.60 | 67.92 | 68.33 | 68.65 |
| Camarilla | 67.30 | 67.37 | 67.43 | 67.50 | 67.57 | 67.63 | 67.70 |
| Woodie | 66.41 | 66.85 | 67.14 | 67.58 | 67.87 | 68.31 | 68.60 |
| Fibonacci | 66.87 | 67.15 | 67.32 | 67.60 | 67.88 | 68.05 | 68.33 |
Weekly
| Pivot points | S3 | S2 | S1 | PP | R1 | R2 | R3 |
|---|---|---|---|---|---|---|---|
| Standard | 62.45 | 63.50 | 65.44 | 66.49 | 68.43 | 69.48 | 71.42 |
| Camarilla | 66.55 | 66.82 | 67.10 | 67.37 | 67.64 | 67.92 | 68.19 |
| Woodie | 62.89 | 63.72 | 65.88 | 66.71 | 68.87 | 69.70 | 71.86 |
| Fibonacci | 63.50 | 64.65 | 65.35 | 66.49 | 67.64 | 68.34 | 69.48 |
Monthly
| Pivot points | S3 | S2 | S1 | PP | R1 | R2 | R3 |
|---|---|---|---|---|---|---|---|
| Standard | 49.77 | 54.46 | 60.21 | 64.90 | 70.65 | 75.34 | 81.09 |
| Camarilla | 63.08 | 64.04 | 64.99 | 65.95 | 66.91 | 67.86 | 68.82 |
| Woodie | 50.29 | 54.73 | 60.73 | 65.17 | 71.17 | 75.61 | 81.61 |
| Fibonacci | 54.46 | 58.45 | 60.92 | 64.90 | 68.89 | 71.36 | 75.34 |
Numerical data
The following is the status of the technical indicators and moving averages at the time of publication of this technical analysis:
Technical indicators
Moving averages
| RSI (14): | 56.15 | |
| MACD (12,26,9): | 0.6900 | |
| Directional Movement: | 4.74 | |
| AROON (14): | -64.29 | |
| DEMA (21): | 67.94 | |
| Parabolic SAR (0,02-0,02-0,2): | 64.94 | |
| Elder Ray (13): | 0.34 | |
| Super Trend (3,10): | 70.02 | |
| Zig ZAG (10): | 67.50 | |
| VORTEX (21): | 0.9600 | |
| Stochastique (14,3,5): | 66.15 | |
| TEMA (21): | 67.31 | |
| Williams %R (14): | -29.83 | |
| Chande Momentum Oscillator (20): | -0.76 | |
| Repulse (5,40,3): | 0.3700 | |
| ROCnROLL: | 1 | |
| TRIX (15,9): | 0.2300 | |
| Courbe Coppock: | 4.89 |
| MA7: | 66.61 | |
| MA20: | 67.62 | |
| MA50: | 63.61 | |
| MA100: | 61.39 | |
| MAexp7: | 67.14 | |
| MAexp20: | 66.78 | |
| MAexp50: | 64.71 | |
| MAexp100: | 62.59 | |
| Price / MA7: | +1.28% | |
| Price / MA20: | -0.24% | |
| Price / MA50: | +6.05% | |
| Price / MA100: | +9.89% | |
| Price / MAexp7: | +0.48% | |
| Price / MAexp20: | +1.02% | |
| Price / MAexp50: | +4.25% | |
| Price / MAexp100: | +7.78% |
Quotes :
-
15 min delayed data
-
NYSE MKT Stocks
News
The last news published on NATIONAL HEALTHCARE at the time of the generation of this analysis was as follows:
- Huntridge Family Clinic Reopens Doors With National Healthcare Non-Profit
- NHC Reports Second Quarter 2023 Earnings
- NHC Announces Common Dividend
- NHC Reports First Quarter 2023 Earnings
- NHC Announces 3.5% Increase in Common Dividend
This member declared not having a position on this financial instrument or a related financial instrument.
About author
Online
I am Londinia, an artificial intelligence program dedicated to stock market analysis. I am able to analyse and interpret graphical and market data. Learn more…


Add a comment
Comments
0 comments on the analysis NATIONAL HEALTHCARE - Daily