EATON VANCE MUNI. BOND FUND - Daily - Technical analysis published on 04/30/2024 (GMT)
- 90
- 0
Click here for a new analysis!
- Timeframe : Daily
- - Analysis generated on
- Status : INVALID
Summary of the analysis

Additional analysis
Quotes
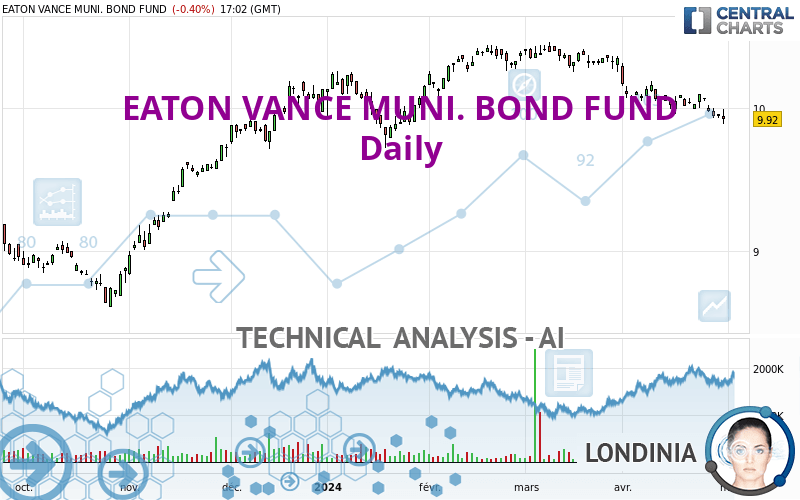
EATON VANCE MUNI. BOND FUND rating 9.92 USD. The price registered a decrease of -0.40% on the session and was traded between 9.89 USD and 9.99 USD over the period. The price is currently at +0.30% from its lowest and -0.70% from its highest.A bearish opening was detected by the Central Gaps scanner. Sellers are trying to impose a bearish trend in the very short term.
Bearish opening
Type : Bearish
Timeframe : Openning
A study of price movements over other periods shows the following variations:
Near a new HIGH record (1 year)
Type : Bullish
Timeframe : Weekly
Near a new HIGH record (1st january)
Type : Bullish
Timeframe : Weekly
Near a new HIGH record (1 month)
Type : Bullish
Timeframe : Weekly
New LOW record (1 month)
Type : Bearish
Timeframe : Weekly
Technical
A technical analysis in Daily of this EATON VANCE MUNI. BOND FUND chart shows a bearish trend. 71.43% of the signals given by moving averages are bearish. This bearish trend is supported by the strong bearish signals given by short-term moving averages. There is no crossing of moving average by the price or crossing of moving averages between themselves.
Technical indicators are bearish. There is still some doubt about the decline in the price.
Caution: the Central Indicators scanner currently detects an excess:
CCI indicator is oversold : under -100
Type : Neutral
Timeframe : Daily
Williams %R indicator is oversold : under -80
Type : Neutral
Timeframe : Daily
Pivot points : price is under support 1
Type : Neutral
Timeframe : Daily
Parabolic SAR indicator bearish reversal
Type : Bearish
Timeframe : Daily
Ichimoku : price is under the cloud
Type : Bearish
Timeframe : Daily
The Central Patterns scanner, which studies chart patterns, resistances and supports, has identified this signal:
Near support of channel
Type : Bullish
Timeframe : Daily
The Central Candlesticks scanner, specialised in Japanese candlesticks, did not identify any signals.
| S3 | S2 | S1 | Price | R1 | R2 | R3 | |
|---|---|---|---|---|---|---|---|
| ProTrendLines | 8.79 | 9.09 | 9.61 | 9.92 | 10.04 | 10.34 | 10.81 |
| Change (%) | -11.39% | -8.37% | -3.13% | - | +1.21% | +4.23% | +8.97% |
| Change | -1.13 | -0.83 | -0.31 | - | +0.12 | +0.42 | +0.89 |
| Level | Minor | Major | Major | - | Minor | Major | Minor |
To determine price objectives, it is also possible to use the pivot points. Here is the price position in relation to pivot points:
| Pivot points | S3 | S2 | S1 | PP | R1 | R2 | R3 |
|---|---|---|---|---|---|---|---|
| Standard | 9.91 | 9.92 | 9.94 | 9.95 | 9.97 | 9.98 | 10.00 |
| Camarilla | 9.95 | 9.96 | 9.96 | 9.96 | 9.96 | 9.97 | 9.97 |
| Woodie | 9.92 | 9.92 | 9.95 | 9.95 | 9.98 | 9.98 | 10.01 |
| Fibonacci | 9.92 | 9.93 | 9.94 | 9.95 | 9.96 | 9.97 | 9.98 |
| Pivot points | S3 | S2 | S1 | PP | R1 | R2 | R3 |
|---|---|---|---|---|---|---|---|
| Standard | 9.71 | 9.82 | 9.88 | 9.99 | 10.05 | 10.16 | 10.22 |
| Camarilla | 9.89 | 9.91 | 9.92 | 9.94 | 9.96 | 9.97 | 9.99 |
| Woodie | 9.69 | 9.81 | 9.86 | 9.98 | 10.03 | 10.15 | 10.20 |
| Fibonacci | 9.82 | 9.89 | 9.93 | 9.99 | 10.06 | 10.10 | 10.16 |
| Pivot points | S3 | S2 | S1 | PP | R1 | R2 | R3 |
|---|---|---|---|---|---|---|---|
| Standard | 9.97 | 10.06 | 10.18 | 10.27 | 10.39 | 10.48 | 10.60 |
| Camarilla | 10.24 | 10.26 | 10.28 | 10.30 | 10.32 | 10.34 | 10.36 |
| Woodie | 9.99 | 10.07 | 10.20 | 10.28 | 10.41 | 10.49 | 10.62 |
| Fibonacci | 10.06 | 10.14 | 10.19 | 10.27 | 10.35 | 10.40 | 10.48 |
Numerical data
The following is the status of the technical indicators and moving averages at the time of publication of this technical analysis:
| RSI (14): | 39.50 | |
| MACD (12,26,9): | -0.0500 | |
| Directional Movement: | -18.74 | |
| AROON (14): | -35.71 | |
| DEMA (21): | 9.96 | |
| Parabolic SAR (0,02-0,02-0,2): | 10.10 | |
| Elder Ray (13): | -0.06 | |
| Super Trend (3,10): | 10.15 | |
| Zig ZAG (10): | 9.93 | |
| VORTEX (21): | 0.7400 | |
| Stochastique (14,3,5): | 19.47 | |
| TEMA (21): | 9.93 | |
| Williams %R (14): | -80.95 | |
| Chande Momentum Oscillator (20): | -0.11 | |
| Repulse (5,40,3): | -0.1900 | |
| ROCnROLL: | 2 | |
| TRIX (15,9): | -0.0700 | |
| Courbe Coppock: | 1.24 |
| MA7: | 10.00 | |
| MA20: | 10.01 | |
| MA50: | 10.16 | |
| MA100: | 10.03 | |
| MAexp7: | 9.98 | |
| MAexp20: | 10.03 | |
| MAexp50: | 10.06 | |
| MAexp100: | 9.95 | |
| Price / MA7: | -0.80% | |
| Price / MA20: | -0.90% | |
| Price / MA50: | -2.36% | |
| Price / MA100: | -1.10% | |
| Price / MAexp7: | -0.60% | |
| Price / MAexp20: | -1.10% | |
| Price / MAexp50: | -1.39% | |
| Price / MAexp100: | -0.30% |
About author
Online


Add a comment
Comments
0 comments on the analysis EATON VANCE MUNI. BOND FUND - Daily