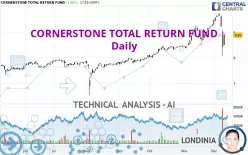
CORNERSTONE TOTAL RETURN FUND - Daily - Technical analysis published on 12/11/2024 (GMT)
- 149
- 0
Click here for a new analysis!
- Timeframe : Daily
- - Analysis generated on
- Status : LEVEL MAINTAINED

Summary of the analysis

Additional analysis
Quotes
CORNERSTONE TOTAL RETURN FUND rating 8.89 USD. The price has increased by +5.58% since the last closing and was traded between 8.50 USD and 8.94 USD over the period. The price is currently at +4.59% from its lowest and -0.56% from its highest.A bullish opening was detected by the Central Gaps scanner. Buyers are trying to impose a bullish momentum in the very short term.
Bullish opening
Type : Bullish
Timeframe : Openning
A study of price movements over other periods shows the following variations:
Abnormal volumes
Timeframe : 5 days
Technical
A technical analysis in Daily of this CORNERSTONE TOTAL RETURN FUND chart shows a bullish trend. 64.29% of the signals given by moving averages are bullish. Caution: the neutral signals currently given by short-term moving averages show us that the global trend is losing momentum. The Central Indicators market scanner is currently detecting several bearish and bullish signals that could impact this trend:
Bearish trend reversal : Moving Average 20
Type : Bearish
Timeframe : Daily
Bearish trend reversal : adaptative moving average 20
Type : Bearish
Timeframe : Daily
Bullish price crossover with Moving Average 50
Type : Bullish
Timeframe : Daily
An assessment of technical indicators does not currently provide any relevant information on the direction of future price movements.
Central Indicators, the detector scanner for these technical indicators has recently detected several signals:
Pivot points : price is under support 3
Type : Neutral
Timeframe : Weekly
Price is back over the pivot point
Type : Bullish
Timeframe : Daily
No signals are given by Central Patterns, a market scanner specialised in chart patterns, resistances and supports.
The presence of a bullish Japanese candlestick pattern detected by Central Candlesticks that could cause a very short term rebound was also detected:
Bullish harami
Type : Bullish
Timeframe : Daily
| S3 | S2 | S1 | Price | R1 | R2 | R3 | |
|---|---|---|---|---|---|---|---|
| ProTrendLines | 6.75 | 7.02 | 8.15 | 8.89 | 9.06 | 9.89 | 10.57 |
| Change (%) | -24.07% | -21.03% | -8.32% | - | +1.91% | +11.25% | +18.90% |
| Change | -2.14 | -1.87 | -0.74 | - | +0.17 | +1.00 | +1.68 |
| Level | Major | Intermediate | Major | - | Major | Minor | Major |
Pivot points can also be used to set your price objectives. Here is the price situation in relation to pivot points:
| Pivot points | S3 | S2 | S1 | PP | R1 | R2 | R3 |
|---|---|---|---|---|---|---|---|
| Standard | 6.91 | 7.49 | 7.95 | 8.53 | 8.99 | 9.57 | 10.03 |
| Camarilla | 8.13 | 8.23 | 8.33 | 8.42 | 8.52 | 8.61 | 8.71 |
| Woodie | 6.86 | 7.46 | 7.90 | 8.50 | 8.94 | 9.54 | 9.98 |
| Fibonacci | 7.49 | 7.88 | 8.13 | 8.53 | 8.92 | 9.17 | 9.57 |
| Pivot points | S3 | S2 | S1 | PP | R1 | R2 | R3 |
|---|---|---|---|---|---|---|---|
| Standard | 8.92 | 9.10 | 9.38 | 9.56 | 9.84 | 10.02 | 10.30 |
| Camarilla | 9.52 | 9.57 | 9.61 | 9.65 | 9.69 | 9.73 | 9.78 |
| Woodie | 8.96 | 9.13 | 9.42 | 9.59 | 9.88 | 10.05 | 10.34 |
| Fibonacci | 9.10 | 9.28 | 9.39 | 9.56 | 9.74 | 9.85 | 10.02 |
| Pivot points | S3 | S2 | S1 | PP | R1 | R2 | R3 |
|---|---|---|---|---|---|---|---|
| Standard | 7.55 | 7.91 | 8.60 | 8.96 | 9.65 | 10.01 | 10.70 |
| Camarilla | 9.01 | 9.11 | 9.20 | 9.30 | 9.40 | 9.49 | 9.59 |
| Woodie | 7.73 | 7.99 | 8.78 | 9.04 | 9.83 | 10.09 | 10.88 |
| Fibonacci | 7.91 | 8.31 | 8.56 | 8.96 | 9.36 | 9.61 | 10.01 |
Numerical data
The following is the status of technical indicators and moving averages registered at the time this technical analysis was created:
| RSI (14): | 40.39 | |
| MACD (12,26,9): | 0.2100 | |
| Directional Movement: | -19.62 | |
| AROON (14): | -14.29 | |
| DEMA (21): | 9.43 | |
| Parabolic SAR (0,02-0,02-0,2): | 9.75 | |
| Elder Ray (13): | 0.13 | |
| Super Trend (3,10): | 9.90 | |
| Zig ZAG (10): | 8.72 | |
| VORTEX (21): | 0.9700 | |
| Stochastique (14,3,5): | 54.64 | |
| TEMA (21): | 9.42 | |
| Williams %R (14): | -80.71 | |
| Chande Momentum Oscillator (20): | -0.20 | |
| Repulse (5,40,3): | 0.1400 | |
| ROCnROLL: | -1 | |
| TRIX (15,9): | 0.4400 | |
| Courbe Coppock: | 10.77 |
| MA7: | 9.42 | |
| MA20: | 9.13 | |
| MA50: | 8.60 | |
| MA100: | 8.03 | |
| MAexp7: | 9.26 | |
| MAexp20: | 9.10 | |
| MAexp50: | 8.68 | |
| MAexp100: | 8.21 | |
| Price / MA7: | -5.63% | |
| Price / MA20: | -2.63% | |
| Price / MA50: | +3.37% | |
| Price / MA100: | +10.71% | |
| Price / MAexp7: | -4.00% | |
| Price / MAexp20: | -2.31% | |
| Price / MAexp50: | +2.42% | |
| Price / MAexp100: | +8.28% |
News
The last news published on CORNERSTONE TOTAL RETURN FUND at the time of the generation of this analysis was as follows:
- Cornerstone Total Return Fund, Inc. Announces Completion of Rights Offering
- Cornerstone Total Return Fund, Inc. Announces the Commencement of Its Rights Offering
- Cornerstone Total Return Fund, Inc. Announces Record Date for Rights Offering
- Cornerstone Total Return Fund, Inc. Announces the Commencement of Its Rights Offering
About author
Online


Add a comment
Comments
0 comments on the analysis CORNERSTONE TOTAL RETURN FUND - Daily