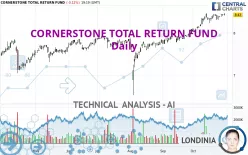
CORNERSTONE TOTAL RETURN FUND - Daily - Technical analysis published on 10/30/2024 (GMT)
- 161
- 0
Click here for a new analysis!
- Timeframe : Daily
- - Analysis generated on
- Status : TARGET REACHED

Summary of the analysis

Additional analysis
Quotes
The CORNERSTONE TOTAL RETURN FUND price is 8.43 USD. The price registered a decrease of -0.12% on the session and was traded between 8.41 USD and 8.47 USD over the period. The price is currently at +0.24% from its lowest and -0.47% from its highest.The Central Gaps scanner detects a bullish opening. A small advantage for buyers in the very short term.
Bullish opening
Type : Bullish
Timeframe : Openning
Here is a more detailed summary of the historical variations registered by CORNERSTONE TOTAL RETURN FUND:
New HIGH record (1 year)
Type : Bullish
Timeframe : Weekly
New HIGH record (1st january)
Type : Bullish
Timeframe : Weekly
New HIGH record (1 month)
Type : Bullish
Timeframe : Weekly
Technical
Technical analysis of CORNERSTONE TOTAL RETURN FUND in Daily shows a strongly overall bullish trend. 92.86% of the signals given by moving averages are bullish. This strongly bullish trend is supported by the strong bullish signals given by short-term moving averages. The Central Indicators market scanner currently does not detect any result that concerns moving averages.
In fact, 12 technical indicators on 18 studied are currently bullish. Caution: the Central Indicators scanner currently detects an excess:
RSI indicator is overbought : over 70
Type : Neutral
Timeframe : Daily
Williams %R indicator is overbought : over -20
Type : Neutral
Timeframe : Daily
The analysis of the price chart with Central Patterns scanners does not return any result.
The Central Candlesticks scanner currently notes the presence of this pattern in Japanese candlesticks that could mark the end of the short-term trend currently underway:
Doji
Type : Neutral
Timeframe : Daily
| S3 | S2 | S1 | Price | R1 | R2 | R3 | |
|---|---|---|---|---|---|---|---|
| ProTrendLines | 7.10 | 7.44 | 8.25 | 8.43 | 9.47 | 10.01 | 10.54 |
| Change (%) | -15.78% | -11.74% | -2.14% | - | +12.34% | +18.74% | +25.03% |
| Change | -1.33 | -0.99 | -0.18 | - | +1.04 | +1.58 | +2.11 |
| Level | Intermediate | Intermediate | Major | - | Minor | Minor | Major |
Pivot points can also be used to set your price objectives. Here is the price situation in relation to pivot points:
| Pivot points | S3 | S2 | S1 | PP | R1 | R2 | R3 |
|---|---|---|---|---|---|---|---|
| Standard | 8.36 | 8.38 | 8.41 | 8.43 | 8.46 | 8.48 | 8.51 |
| Camarilla | 8.43 | 8.43 | 8.44 | 8.44 | 8.45 | 8.45 | 8.45 |
| Woodie | 8.37 | 8.38 | 8.42 | 8.43 | 8.47 | 8.48 | 8.52 |
| Fibonacci | 8.38 | 8.40 | 8.41 | 8.43 | 8.45 | 8.46 | 8.48 |
| Pivot points | S3 | S2 | S1 | PP | R1 | R2 | R3 |
|---|---|---|---|---|---|---|---|
| Standard | 8.18 | 8.24 | 8.32 | 8.38 | 8.46 | 8.52 | 8.60 |
| Camarilla | 8.36 | 8.37 | 8.39 | 8.40 | 8.41 | 8.43 | 8.44 |
| Woodie | 8.19 | 8.25 | 8.33 | 8.39 | 8.47 | 8.53 | 8.61 |
| Fibonacci | 8.24 | 8.29 | 8.33 | 8.38 | 8.43 | 8.47 | 8.52 |
| Pivot points | S3 | S2 | S1 | PP | R1 | R2 | R3 |
|---|---|---|---|---|---|---|---|
| Standard | 7.25 | 7.39 | 7.69 | 7.83 | 8.13 | 8.27 | 8.57 |
| Camarilla | 7.86 | 7.90 | 7.94 | 7.98 | 8.02 | 8.06 | 8.10 |
| Woodie | 7.32 | 7.43 | 7.76 | 7.87 | 8.20 | 8.31 | 8.64 |
| Fibonacci | 7.39 | 7.56 | 7.67 | 7.83 | 8.00 | 8.11 | 8.27 |
Numerical data
The following is the status of technical indicators and moving averages registered at the time this technical analysis was created:
| RSI (14): | 74.81 | |
| MACD (12,26,9): | 0.1500 | |
| Directional Movement: | 19.20 | |
| AROON (14): | 100.00 | |
| DEMA (21): | 8.49 | |
| Parabolic SAR (0,02-0,02-0,2): | 8.31 | |
| Elder Ray (13): | 0.08 | |
| Super Trend (3,10): | 8.22 | |
| Zig ZAG (10): | 8.46 | |
| VORTEX (21): | 1.2800 | |
| Stochastique (14,3,5): | 95.80 | |
| TEMA (21): | 8.50 | |
| Williams %R (14): | -7.41 | |
| Chande Momentum Oscillator (20): | 0.12 | |
| Repulse (5,40,3): | 0.6800 | |
| ROCnROLL: | 1 | |
| TRIX (15,9): | 0.2900 | |
| Courbe Coppock: | 6.58 |
| MA7: | 8.41 | |
| MA20: | 8.29 | |
| MA50: | 7.94 | |
| MA100: | 7.66 | |
| MAexp7: | 8.41 | |
| MAexp20: | 8.28 | |
| MAexp50: | 8.01 | |
| MAexp100: | 7.70 | |
| Price / MA7: | +0.24% | |
| Price / MA20: | +1.69% | |
| Price / MA50: | +6.17% | |
| Price / MA100: | +10.05% | |
| Price / MAexp7: | +0.24% | |
| Price / MAexp20: | +1.81% | |
| Price / MAexp50: | +5.24% | |
| Price / MAexp100: | +9.48% |
News
The latest news and videos published on CORNERSTONE TOTAL RETURN FUND at the time of the analysis were as follows:
- Cornerstone Total Return Fund, Inc. Announces Completion of Rights Offering
- Cornerstone Total Return Fund, Inc. Announces the Commencement of Its Rights Offering
- Cornerstone Total Return Fund, Inc. Announces Record Date for Rights Offering
- Cornerstone Total Return Fund, Inc. Announces the Commencement of Its Rights Offering
About author
Online


Add a comment
Comments
0 comments on the analysis CORNERSTONE TOTAL RETURN FUND - Daily