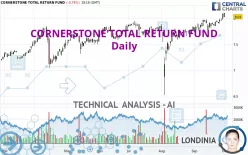
CORNERSTONE TOTAL RETURN FUND - Daily - Technical analysis published on 10/01/2024 (GMT)
- 137
- 0
Click here for a new analysis!
- Timeframe : Daily
- - Analysis generated on
- Status : TARGET REACHED

Summary of the analysis

Additional analysis
Quotes
The CORNERSTONE TOTAL RETURN FUND rating is 8.02 USD. On the day, this instrument lost -0.87% and was traded between 8.02 USD and 8.10 USD over the period. The price is currently at 0% from its lowest and -0.99% from its highest.A bullish gap was detected at the opening by the Central Gaps scanner. There are a lot of buyers and they have the upper hand in the very short term.
Opening Gap UP
Type : Bullish
Timeframe : Openning
Here is a more detailed summary of the historical variations registered by CORNERSTONE TOTAL RETURN FUND:
New HIGH record (1 year)
Type : Bullish
Timeframe : Weekly
New HIGH record (1st january)
Type : Bullish
Timeframe : Weekly
New HIGH record (1 month)
Type : Bullish
Timeframe : Weekly
Technical
A technical analysis in Daily of this CORNERSTONE TOTAL RETURN FUND chart shows a strongly bullish trend. 92.86% of the signals given by moving averages are bullish. The overall trend is supported by the strong bullish signals from short-term moving averages. The Central Indicators market scanner currently does not detect any result that concerns moving averages.
The technical indicators are bullish. There is still some doubt about the price increase.
But beware of excesses. The Central Indicators scanner currently detects this:
CCI indicator is overbought : over 100
Type : Neutral
Timeframe : Daily
Previous candle closed over Bollinger bands
Type : Neutral
Timeframe : Daily
Williams %R indicator is overbought : over -20
Type : Neutral
Timeframe : Daily
Pivot points : price is over resistance 1
Type : Neutral
Timeframe : Weekly
Price is back under the pivot point
Type : Bearish
Timeframe : Daily
The Central Patterns scanner, which studies chart patterns, resistances and supports, has identified this signal:
Near resistance of channel
Type : Bearish
Timeframe : Daily
For a small setback in the very short term, the Central Candlesticks scanner currently notes the presence of this bearish pattern in Japanese candlesticks:
Dark cloud cover
Type : Bearish
Timeframe : Daily
| S3 | S2 | S1 | Price | R1 | R2 | R3 | |
|---|---|---|---|---|---|---|---|
| ProTrendLines | 6.92 | 7.19 | 7.54 | 8.02 | 8.36 | 8.92 | 10.14 |
| Change (%) | -13.72% | -10.35% | -5.99% | - | +4.24% | +11.22% | +26.43% |
| Change | -1.10 | -0.83 | -0.48 | - | +0.34 | +0.90 | +2.12 |
| Level | Major | Intermediate | Intermediate | - | Intermediate | Minor | Minor |
To determine price objectives, it is also possible to use the pivot points. Here is the price position in relation to pivot points:
| Pivot points | S3 | S2 | S1 | PP | R1 | R2 | R3 |
|---|---|---|---|---|---|---|---|
| Standard | 7.89 | 7.93 | 8.01 | 8.05 | 8.13 | 8.17 | 8.25 |
| Camarilla | 8.06 | 8.07 | 8.08 | 8.09 | 8.10 | 8.11 | 8.12 |
| Woodie | 7.91 | 7.94 | 8.03 | 8.06 | 8.15 | 8.18 | 8.27 |
| Fibonacci | 7.93 | 7.98 | 8.00 | 8.05 | 8.10 | 8.12 | 8.17 |
| Pivot points | S3 | S2 | S1 | PP | R1 | R2 | R3 |
|---|---|---|---|---|---|---|---|
| Standard | 7.73 | 7.79 | 7.88 | 7.94 | 8.03 | 8.09 | 8.18 |
| Camarilla | 7.93 | 7.94 | 7.96 | 7.97 | 7.98 | 8.00 | 8.01 |
| Woodie | 7.75 | 7.80 | 7.90 | 7.95 | 8.05 | 8.10 | 8.20 |
| Fibonacci | 7.79 | 7.85 | 7.88 | 7.94 | 8.00 | 8.03 | 8.09 |
| Pivot points | S3 | S2 | S1 | PP | R1 | R2 | R3 |
|---|---|---|---|---|---|---|---|
| Standard | 7.34 | 7.49 | 7.79 | 7.94 | 8.24 | 8.39 | 8.69 |
| Camarilla | 7.97 | 8.01 | 8.05 | 8.09 | 8.13 | 8.17 | 8.21 |
| Woodie | 7.42 | 7.53 | 7.87 | 7.98 | 8.32 | 8.43 | 8.77 |
| Fibonacci | 7.49 | 7.66 | 7.77 | 7.94 | 8.11 | 8.22 | 8.39 |
Numerical data
The following is the status of technical indicators and moving averages registered at the time this technical analysis was created:
| RSI (14): | 67.43 | |
| MACD (12,26,9): | 0.1000 | |
| Directional Movement: | 15.70 | |
| AROON (14): | 100.00 | |
| DEMA (21): | 8.01 | |
| Parabolic SAR (0,02-0,02-0,2): | 7.94 | |
| Elder Ray (13): | 0.13 | |
| Super Trend (3,10): | 7.82 | |
| Zig ZAG (10): | 8.04 | |
| VORTEX (21): | 1.2100 | |
| Stochastique (14,3,5): | 89.77 | |
| TEMA (21): | 8.04 | |
| Williams %R (14): | -18.78 | |
| Chande Momentum Oscillator (20): | 0.23 | |
| Repulse (5,40,3): | 0.6700 | |
| ROCnROLL: | 1 | |
| TRIX (15,9): | 0.1800 | |
| Courbe Coppock: | 5.07 |
| MA7: | 7.98 | |
| MA20: | 7.87 | |
| MA50: | 7.66 | |
| MA100: | 7.51 | |
| MAexp7: | 7.99 | |
| MAexp20: | 7.88 | |
| MAexp50: | 7.71 | |
| MAexp100: | 7.50 | |
| Price / MA7: | +0.50% | |
| Price / MA20: | +1.91% | |
| Price / MA50: | +4.70% | |
| Price / MA100: | +6.79% | |
| Price / MAexp7: | +0.38% | |
| Price / MAexp20: | +1.78% | |
| Price / MAexp50: | +4.02% | |
| Price / MAexp100: | +6.93% |
News
The latest news and videos published on CORNERSTONE TOTAL RETURN FUND at the time of the analysis were as follows:
- Cornerstone Total Return Fund, Inc. Announces Completion of Rights Offering
- Cornerstone Total Return Fund, Inc. Announces the Commencement of Its Rights Offering
- Cornerstone Total Return Fund, Inc. Announces Record Date for Rights Offering
- Cornerstone Total Return Fund, Inc. Announces the Commencement of Its Rights Offering
About author
Online


Add a comment
Comments
0 comments on the analysis CORNERSTONE TOTAL RETURN FUND - Daily