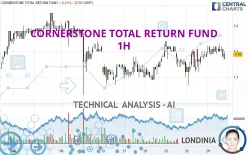
CORNERSTONE TOTAL RETURN FUND - 1H - Technical analysis published on 07/30/2024 (GMT)
- 448
- 0
Click here for a new analysis!
- Timeframe : 1H
- - Analysis generated on
- Status : INVALID

Summary of the analysis

Additional analysis
Quotes
CORNERSTONE TOTAL RETURN FUND rating 7.78 USD. The price is lower by -0.26% since the last closing with the lowest point at 7.77 USD and the highest point at 7.83 USD. The deviation from the price is +0.13% for the low point and -0.64% for the high point.Here is a more detailed summary of the historical variations registered by CORNERSTONE TOTAL RETURN FUND:
Near a new HIGH record (1 year)
Type : Bullish
Timeframe : Weekly
Near a new HIGH record (1st january)
Type : Bullish
Timeframe : Weekly
Near a new LOW record (1 month)
Type : Bearish
Timeframe : Weekly
Technical
Technical analysis of CORNERSTONE TOTAL RETURN FUND in 1H shows an overall bullish trend. 75.00% of the signals given by moving averages are bullish. Caution: the neutral signals currently given by the short-term moving averages indicate that this bullish trend is showing signs of running out of steam. An assessment of moving averages reveals several bearish and bullish signals:
Bearish trend reversal : adaptative moving average 20
Type : Bearish
Timeframe : 1 hour
Bullish price crossover with adaptative moving average 20
Type : Bullish
Timeframe : 1 hour
An assessment of technical indicators does not currently provide any relevant information on the direction of future price movements.
Central Indicators, the scanner specialised in technical indicators, has identified these signals:
Pivot points : price is under support 1
Type : Neutral
Timeframe : 1 hour
Momentum indicator is back over 0
Type : Bullish
Timeframe : 1 hour
The Central Patterns scanner, which studies chart patterns, resistances and supports, has identified these signals:
Near resistance of channel
Type : Bearish
Timeframe : 1 hour
Near support of triangle
Type : Bullish
Timeframe : 1 hour
No result was found by the Central Candlesticks scanner on Japanese candlesticks.
| S3 | S2 | S1 | Price | R1 | R2 | R3 | |
|---|---|---|---|---|---|---|---|
| ProTrendLines | 7.59 | 7.67 | 7.75 | 7.78 | 7.81 | 7.84 | 8.58 |
| Change (%) | -2.44% | -1.41% | -0.39% | - | +0.39% | +0.77% | +10.28% |
| Change | -0.19 | -0.11 | -0.03 | - | +0.03 | +0.06 | +0.80 |
| Level | Minor | Intermediate | Major | - | Minor | Intermediate | Intermediate |
To determine price objectives, it is also possible to use the pivot points. Here is the price position in relation to pivot points:
| Pivot points | S3 | S2 | S1 | PP | R1 | R2 | R3 |
|---|---|---|---|---|---|---|---|
| Standard | 7.76 | 7.77 | 7.79 | 7.80 | 7.82 | 7.83 | 7.85 |
| Camarilla | 7.79 | 7.80 | 7.80 | 7.80 | 7.80 | 7.81 | 7.81 |
| Woodie | 7.76 | 7.77 | 7.79 | 7.80 | 7.82 | 7.83 | 7.85 |
| Fibonacci | 7.77 | 7.79 | 7.79 | 7.80 | 7.82 | 7.82 | 7.83 |
| Pivot points | S3 | S2 | S1 | PP | R1 | R2 | R3 |
|---|---|---|---|---|---|---|---|
| Standard | 7.53 | 7.60 | 7.70 | 7.77 | 7.87 | 7.94 | 8.04 |
| Camarilla | 7.75 | 7.77 | 7.78 | 7.80 | 7.82 | 7.83 | 7.85 |
| Woodie | 7.55 | 7.61 | 7.72 | 7.78 | 7.89 | 7.95 | 8.06 |
| Fibonacci | 7.60 | 7.67 | 7.71 | 7.77 | 7.84 | 7.88 | 7.94 |
| Pivot points | S3 | S2 | S1 | PP | R1 | R2 | R3 |
|---|---|---|---|---|---|---|---|
| Standard | 7.20 | 7.32 | 7.53 | 7.65 | 7.86 | 7.98 | 8.19 |
| Camarilla | 7.65 | 7.68 | 7.71 | 7.74 | 7.77 | 7.80 | 7.83 |
| Woodie | 7.25 | 7.34 | 7.58 | 7.67 | 7.91 | 8.00 | 8.24 |
| Fibonacci | 7.32 | 7.45 | 7.52 | 7.65 | 7.78 | 7.85 | 7.98 |
Numerical data
The following is the status of technical indicators and moving averages registered at the time this technical analysis was created:
| RSI (14): | 48.28 | |
| MACD (12,26,9): | 0.0100 | |
| Directional Movement: | -3.02 | |
| AROON (14): | 78.57 | |
| DEMA (21): | 7.80 | |
| Parabolic SAR (0,02-0,02-0,2): | 7.83 | |
| Elder Ray (13): | -0.01 | |
| Super Trend (3,10): | 7.73 | |
| Zig ZAG (10): | 7.78 | |
| VORTEX (21): | 0.9600 | |
| Stochastique (14,3,5): | 29.33 | |
| TEMA (21): | 7.80 | |
| Williams %R (14): | -75.00 | |
| Chande Momentum Oscillator (20): | 0.00 | |
| Repulse (5,40,3): | -0.2200 | |
| ROCnROLL: | -1 | |
| TRIX (15,9): | 0.0200 | |
| Courbe Coppock: | 0.54 |
| MA7: | 7.78 | |
| MA20: | 7.76 | |
| MA50: | 7.61 | |
| MA100: | 7.36 | |
| MAexp7: | 7.80 | |
| MAexp20: | 7.79 | |
| MAexp50: | 7.77 | |
| MAexp100: | 7.75 | |
| Price / MA7: | -0% | |
| Price / MA20: | +0.26% | |
| Price / MA50: | +2.23% | |
| Price / MA100: | +5.71% | |
| Price / MAexp7: | -0.26% | |
| Price / MAexp20: | -0.13% | |
| Price / MAexp50: | +0.13% | |
| Price / MAexp100: | +0.39% |
News
The last news published on CORNERSTONE TOTAL RETURN FUND at the time of the generation of this analysis was as follows:
- Cornerstone Total Return Fund, Inc. Announces Completion of Rights Offering
- Cornerstone Total Return Fund, Inc. Announces the Commencement of Its Rights Offering
- Cornerstone Total Return Fund, Inc. Announces Record Date for Rights Offering
- Cornerstone Total Return Fund, Inc. Announces the Commencement of Its Rights Offering
About author
Online


Add a comment
Comments
0 comments on the analysis CORNERSTONE TOTAL RETURN FUND - 1H