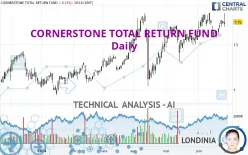
CORNERSTONE TOTAL RETURN FUND - Daily - Technical analysis published on 06/27/2024 (GMT)
- 173
- 0
Click here for a new analysis!
- Timeframe : Daily
- - Analysis generated on
- Status : LEVEL MAINTAINED

Summary of the analysis

Additional analysis
Quotes
The CORNERSTONE TOTAL RETURN FUND price is 7.75 USD. The price registered a decrease of -0.13% on the session with the lowest point at 7.70 USD and the highest point at 7.85 USD. The deviation from the price is +0.65% for the low point and -1.27% for the high point.A bearish opening was detected by the Central Gaps scanner. Sellers are trying to impose a bearish trend in the very short term.
Bearish opening
Type : Bearish
Timeframe : Openning
Here is a more detailed summary of the historical variations registered by CORNERSTONE TOTAL RETURN FUND:
New HIGH record (1 year)
Type : Bullish
Timeframe : Weekly
New HIGH record (1st january)
Type : Bullish
Timeframe : Weekly
New HIGH record (1 month)
Type : Bullish
Timeframe : Weekly
Technical
Technical analysis of CORNERSTONE TOTAL RETURN FUND in Daily shows a strongly overall bullish trend. 92.86% of the signals given by moving averages are bullish. This strongly bullish trend is supported by the strong bullish signals given by short-term moving averages. The Central Indicators scanner does not detect any result on moving averages that would impact this trend.
Technical indicators are strongly bullish, suggesting that the price increase should continue.
But beware of excesses. The Central Indicators scanner currently detects this:
CCI indicator is overbought : over 100
Type : Neutral
Timeframe : Daily
Pivot points : price is over resistance 1
Type : Neutral
Timeframe : Weekly
MACD crosses DOWN its Moving Average
Type : Bearish
Timeframe : Daily
Central Patterns, the market scanner focusing on chart patterns, resistances and supports found this result:
Near resistance of channel
Type : Bearish
Timeframe : Daily
The Central Candlesticks scanner which studies Japanese candlesticks did not detect anything.
| S3 | S2 | S1 | Price | R1 | R2 | R3 | |
|---|---|---|---|---|---|---|---|
| ProTrendLines | 6.69 | 7.21 | 7.50 | 7.75 | 8.71 | 10.00 | 10.57 |
| Change (%) | -13.68% | -6.97% | -3.23% | - | +12.39% | +29.03% | +36.39% |
| Change | -1.06 | -0.54 | -0.25 | - | +0.96 | +2.25 | +2.82 |
| Level | Intermediate | Intermediate | Major | - | Intermediate | Minor | Minor |
Attention could also be paid to pivot points to set price objectives:
| Pivot points | S3 | S2 | S1 | PP | R1 | R2 | R3 |
|---|---|---|---|---|---|---|---|
| Standard | 7.71 | 7.72 | 7.74 | 7.75 | 7.77 | 7.78 | 7.80 |
| Camarilla | 7.75 | 7.76 | 7.76 | 7.76 | 7.76 | 7.77 | 7.77 |
| Woodie | 7.72 | 7.72 | 7.75 | 7.75 | 7.78 | 7.78 | 7.81 |
| Fibonacci | 7.72 | 7.73 | 7.74 | 7.75 | 7.76 | 7.77 | 7.78 |
| Pivot points | S3 | S2 | S1 | PP | R1 | R2 | R3 |
|---|---|---|---|---|---|---|---|
| Standard | 7.49 | 7.54 | 7.60 | 7.65 | 7.71 | 7.76 | 7.82 |
| Camarilla | 7.64 | 7.65 | 7.66 | 7.67 | 7.68 | 7.69 | 7.70 |
| Woodie | 7.51 | 7.54 | 7.62 | 7.65 | 7.73 | 7.76 | 7.84 |
| Fibonacci | 7.54 | 7.58 | 7.61 | 7.65 | 7.69 | 7.72 | 7.76 |
| Pivot points | S3 | S2 | S1 | PP | R1 | R2 | R3 |
|---|---|---|---|---|---|---|---|
| Standard | 6.97 | 7.10 | 7.32 | 7.45 | 7.67 | 7.80 | 8.02 |
| Camarilla | 7.45 | 7.49 | 7.52 | 7.55 | 7.58 | 7.61 | 7.65 |
| Woodie | 7.03 | 7.12 | 7.38 | 7.47 | 7.73 | 7.82 | 8.08 |
| Fibonacci | 7.10 | 7.23 | 7.31 | 7.45 | 7.58 | 7.66 | 7.80 |
Numerical data
The following are the details of the technical indicators and moving averages that were collected to generate this technical analysis:
| RSI (14): | 65.21 | |
| MACD (12,26,9): | 0.0700 | |
| Directional Movement: | 21.22 | |
| AROON (14): | 35.71 | |
| DEMA (21): | 7.75 | |
| Parabolic SAR (0,02-0,02-0,2): | 7.60 | |
| Elder Ray (13): | 0.10 | |
| Super Trend (3,10): | 7.52 | |
| Zig ZAG (10): | 7.74 | |
| VORTEX (21): | 1.1600 | |
| Stochastique (14,3,5): | 85.30 | |
| TEMA (21): | 7.75 | |
| Williams %R (14): | -36.99 | |
| Chande Momentum Oscillator (20): | 0.12 | |
| Repulse (5,40,3): | 0.5100 | |
| ROCnROLL: | 1 | |
| TRIX (15,9): | 0.1400 | |
| Courbe Coppock: | 2.15 |
| MA7: | 7.70 | |
| MA20: | 7.66 | |
| MA50: | 7.47 | |
| MA100: | 7.22 | |
| MAexp7: | 7.72 | |
| MAexp20: | 7.65 | |
| MAexp50: | 7.49 | |
| MAexp100: | 7.29 | |
| Price / MA7: | +0.65% | |
| Price / MA20: | +1.17% | |
| Price / MA50: | +3.75% | |
| Price / MA100: | +7.34% | |
| Price / MAexp7: | +0.39% | |
| Price / MAexp20: | +1.31% | |
| Price / MAexp50: | +3.47% | |
| Price / MAexp100: | +6.31% |
News
The latest news and videos published on CORNERSTONE TOTAL RETURN FUND at the time of the analysis were as follows:
- Cornerstone Total Return Fund, Inc. Announces Completion of Rights Offering
- Cornerstone Total Return Fund, Inc. Announces the Commencement of Its Rights Offering
- Cornerstone Total Return Fund, Inc. Announces Record Date for Rights Offering
- Cornerstone Total Return Fund, Inc. Announces the Commencement of Its Rights Offering
About author
Online


Add a comment
Comments
0 comments on the analysis CORNERSTONE TOTAL RETURN FUND - Daily