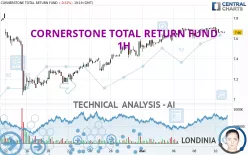
CORNERSTONE TOTAL RETURN FUND - 1H - Technical analysis published on 05/10/2024 (GMT)
- 176
- 0
Click here for a new analysis!
- Timeframe : 1H
- - Analysis generated on
- Status : INVALID

Summary of the analysis

Additional analysis
Quotes
The CORNERSTONE TOTAL RETURN FUND price is 7.67 USD. The price registered a decrease of -0.39% on the session with the lowest point at 7.65 USD and the highest point at 7.71 USD. The deviation from the price is +0.26% for the low point and -0.52% for the high point.The Central Gaps scanner detects a bullish opening. A small advantage for buyers in the very short term.
Bullish opening
Type : Bullish
Timeframe : Openning
Here is a more detailed summary of the historical variations registered by CORNERSTONE TOTAL RETURN FUND:
Near a new HIGH record (1 year)
Type : Bullish
Timeframe : Weekly
Near a new HIGH record (1st january)
Type : Bullish
Timeframe : Weekly
Near a new HIGH record (1 month)
Type : Bullish
Timeframe : Weekly
Technical
Technical analysis of this 1H chart of CORNERSTONE TOTAL RETURN FUND indicates that the overall trend is bullish. The signals given by moving averages are 75.00% bullish. This bullish trend could slow down given the neutral signals currently being given by short-term moving averages. The Central Indicators market scanner currently does not detect any result that concerns moving averages.
An assessment of technical indicators does not currently provide any relevant information to suggest whether the signal given by the technical indicators is more bullish or bearish.
The Central Indicators scanner found this result concerning these indicators:
Pivot points : price is over resistance 1
Type : Neutral
Timeframe : Weekly
The Central Patterns scanner, which studies chart patterns, resistances and supports, has identified this signal:
Near support of channel
Type : Bullish
Timeframe : 1 hour
There is also a Japanese candlestick pattern detected by Central Candlesticks that could mark the end of the current short-term trend:
Doji
Type : Neutral
Timeframe : 1 hour
| S3 | S2 | S1 | Price | R1 | R2 | R3 | |
|---|---|---|---|---|---|---|---|
| ProTrendLines | 7.12 | 7.28 | 7.41 | 7.67 | 7.71 | 8.95 | 10.28 |
| Change (%) | -7.17% | -5.08% | -3.39% | - | +0.52% | +16.69% | +34.03% |
| Change | -0.55 | -0.39 | -0.26 | - | +0.04 | +1.28 | +2.61 |
| Level | Intermediate | Minor | Major | - | Major | Intermediate | Minor |
Pivot points can also be used to set your price objectives. Here is the price situation in relation to pivot points:
| Pivot points | S3 | S2 | S1 | PP | R1 | R2 | R3 |
|---|---|---|---|---|---|---|---|
| Standard | 7.60 | 7.63 | 7.66 | 7.69 | 7.72 | 7.75 | 7.78 |
| Camarilla | 7.68 | 7.69 | 7.70 | 7.70 | 7.71 | 7.71 | 7.72 |
| Woodie | 7.61 | 7.63 | 7.67 | 7.69 | 7.73 | 7.75 | 7.79 |
| Fibonacci | 7.63 | 7.65 | 7.66 | 7.69 | 7.71 | 7.72 | 7.75 |
| Pivot points | S3 | S2 | S1 | PP | R1 | R2 | R3 |
|---|---|---|---|---|---|---|---|
| Standard | 7.21 | 7.31 | 7.44 | 7.54 | 7.67 | 7.77 | 7.90 |
| Camarilla | 7.51 | 7.53 | 7.55 | 7.57 | 7.59 | 7.61 | 7.63 |
| Woodie | 7.23 | 7.32 | 7.46 | 7.55 | 7.69 | 7.78 | 7.92 |
| Fibonacci | 7.31 | 7.40 | 7.45 | 7.54 | 7.63 | 7.68 | 7.77 |
| Pivot points | S3 | S2 | S1 | PP | R1 | R2 | R3 |
|---|---|---|---|---|---|---|---|
| Standard | 6.42 | 6.73 | 7.12 | 7.43 | 7.82 | 8.13 | 8.52 |
| Camarilla | 7.32 | 7.38 | 7.45 | 7.51 | 7.57 | 7.64 | 7.70 |
| Woodie | 6.46 | 6.75 | 7.16 | 7.45 | 7.86 | 8.15 | 8.56 |
| Fibonacci | 6.73 | 7.00 | 7.16 | 7.43 | 7.70 | 7.86 | 8.13 |
Numerical data
The following is the status of technical indicators and moving averages registered at the time this technical analysis was created:
| RSI (14): | 46.89 | |
| MACD (12,26,9): | 0.0100 | |
| Directional Movement: | -9.46 | |
| AROON (14): | 35.72 | |
| DEMA (21): | 7.68 | |
| Parabolic SAR (0,02-0,02-0,2): | 7.64 | |
| Elder Ray (13): | -0.01 | |
| Super Trend (3,10): | 7.62 | |
| Zig ZAG (10): | 7.66 | |
| VORTEX (21): | 0.9500 | |
| Stochastique (14,3,5): | 25.00 | |
| TEMA (21): | 7.67 | |
| Williams %R (14): | -75.00 | |
| Chande Momentum Oscillator (20): | -0.01 | |
| Repulse (5,40,3): | -0.1100 | |
| ROCnROLL: | -1 | |
| TRIX (15,9): | 0.0300 | |
| Courbe Coppock: | 0.01 |
| MA7: | 7.64 | |
| MA20: | 7.44 | |
| MA50: | 7.36 | |
| MA100: | 7.10 | |
| MAexp7: | 7.67 | |
| MAexp20: | 7.67 | |
| MAexp50: | 7.63 | |
| MAexp100: | 7.56 | |
| Price / MA7: | +0.39% | |
| Price / MA20: | +3.09% | |
| Price / MA50: | +4.21% | |
| Price / MA100: | +8.03% | |
| Price / MAexp7: | -0% | |
| Price / MAexp20: | -0% | |
| Price / MAexp50: | +0.52% | |
| Price / MAexp100: | +1.46% |
News
Don't forget to follow the news on CORNERSTONE TOTAL RETURN FUND. At the time of publication of this analysis, the latest news was as follows:
- Cornerstone Total Return Fund, Inc. Announces Completion of Rights Offering
- Cornerstone Total Return Fund, Inc. Announces the Commencement of Its Rights Offering
- Cornerstone Total Return Fund, Inc. Announces Record Date for Rights Offering
- Cornerstone Total Return Fund, Inc. Announces the Commencement of Its Rights Offering
About author
Online


Add a comment
Comments
0 comments on the analysis CORNERSTONE TOTAL RETURN FUND - 1H