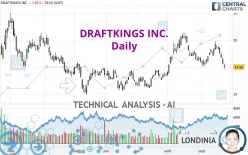
DRAFTKINGS INC. - Daily - Technical analysis published on 09/25/2022 (GMT)
- 285
- 0
Click here for a new analysis!
- Timeframe : Daily
- - Analysis generated on
- Status : INVALID

Summary of the analysis

Additional analysis
Quotes
DRAFTKINGS INC. rating 14.98 USD. The price registered a decrease of -3.85% on the session with the lowest point at 14.57 USD and the highest point at 15.65 USD. The deviation from the price is +2.81% for the low point and -4.28% for the high point.The Central Gaps scanner detects the formation of a bearish gap marking the strong presence of sellers ahead of buyers at the opening. This formed a quotation gap.
Opening Gap DOWN
Type : Bearish
Timeframe : Openning
Here is a more detailed summary of the historical variations registered by DRAFTKINGS INC.:
New LOW record (1 month)
Type : Bearish
Timeframe : Weekly
Technical
A technical analysis in Daily of this DRAFTKINGS INC. chart shows a bearish trend. 64.29% of the signals given by moving averages are bearish. The overall trend is reinforced by the strong bearish signals from short-term moving averages. The Central Indicators scanner detects bearish signals on moving averages that could impact this trend:
Bearish trend reversal : adaptative moving average 50
Type : Bearish
Timeframe : Daily
Bearish price crossover with adaptative moving average 100
Type : Bearish
Timeframe : Daily
In fact, 10 technical indicators on 18 studied are currently bearish. Caution: the Central Indicators scanner currently detects an excess:
CCI indicator is oversold : under -100
Type : Neutral
Timeframe : Daily
Williams %R indicator is oversold : under -80
Type : Neutral
Timeframe : Daily
Pivot points : price is under support 1
Type : Neutral
Timeframe : Daily
Pivot points : price is under support 3
Type : Neutral
Timeframe : Weekly
MACD indicator is back under 0
Type : Bearish
Timeframe : Daily
No signals are given by Central Patterns, a market scanner specialised in chart patterns, resistances and supports.
The Central Candlesticks scanner, specialised in Japanese candlesticks, did not identify any signals.
| S2 | S1 | Price | R1 | R2 | R3 | |
|---|---|---|---|---|---|---|
| ProTrendLines | 10.32 | 12.67 | 14.98 | 15.26 | 17.29 | 20.76 |
| Change (%) | -31.11% | -15.42% | - | +1.87% | +15.42% | +38.58% |
| Change | -4.66 | -2.31 | - | +0.28 | +2.31 | +5.78 |
| Level | Major | Minor | - | Major | Intermediate | Intermediate |
To determine price objectives, it is also possible to use the pivot points. Here is the price position in relation to pivot points:
| Pivot points | S3 | S2 | S1 | PP | R1 | R2 | R3 |
|---|---|---|---|---|---|---|---|
| Standard | 13.40 | 13.99 | 14.48 | 15.07 | 15.56 | 16.15 | 16.64 |
| Camarilla | 14.68 | 14.78 | 14.88 | 14.98 | 15.08 | 15.18 | 15.28 |
| Woodie | 13.36 | 13.97 | 14.44 | 15.05 | 15.52 | 16.13 | 16.60 |
| Fibonacci | 13.99 | 14.40 | 14.65 | 15.07 | 15.48 | 15.73 | 16.15 |
| Pivot points | S3 | S2 | S1 | PP | R1 | R2 | R3 |
|---|---|---|---|---|---|---|---|
| Standard | 9.23 | 11.90 | 13.44 | 16.11 | 17.65 | 20.32 | 21.86 |
| Camarilla | 13.82 | 14.21 | 14.59 | 14.98 | 15.37 | 15.75 | 16.14 |
| Woodie | 8.67 | 11.62 | 12.88 | 15.83 | 17.09 | 20.04 | 21.30 |
| Fibonacci | 11.90 | 13.51 | 14.50 | 16.11 | 17.72 | 18.71 | 20.32 |
| Pivot points | S3 | S2 | S1 | PP | R1 | R2 | R3 |
|---|---|---|---|---|---|---|---|
| Standard | 4.24 | 8.76 | 12.41 | 16.93 | 20.58 | 25.10 | 28.75 |
| Camarilla | 13.81 | 14.56 | 15.31 | 16.06 | 16.81 | 17.56 | 18.31 |
| Woodie | 3.81 | 8.54 | 11.98 | 16.71 | 20.15 | 24.88 | 28.32 |
| Fibonacci | 8.76 | 11.88 | 13.81 | 16.93 | 20.05 | 21.98 | 25.10 |
Numerical data
The following is the status of the technical indicators and moving averages at the time of publication of this technical analysis:
| RSI (14): | 38.17 | |
| MACD (12,26,9): | -0.0700 | |
| Directional Movement: | -11.32 | |
| AROON (14): | -42.86 | |
| DEMA (21): | 17.15 | |
| Parabolic SAR (0,02-0,02-0,2): | 19.56 | |
| Elder Ray (13): | -1.89 | |
| Super Trend (3,10): | 18.30 | |
| Zig ZAG (10): | 14.98 | |
| VORTEX (21): | 0.8600 | |
| Stochastique (14,3,5): | 17.36 | |
| TEMA (21): | 16.61 | |
| Williams %R (14): | -92.15 | |
| Chande Momentum Oscillator (20): | -1.38 | |
| Repulse (5,40,3): | -12.5700 | |
| ROCnROLL: | 2 | |
| TRIX (15,9): | 0.1800 | |
| Courbe Coppock: | 9.34 |
| MA7: | 17.32 | |
| MA20: | 16.94 | |
| MA50: | 16.64 | |
| MA100: | 14.76 | |
| MAexp7: | 16.63 | |
| MAexp20: | 17.08 | |
| MAexp50: | 16.54 | |
| MAexp100: | 16.84 | |
| Price / MA7: | -13.51% | |
| Price / MA20: | -11.57% | |
| Price / MA50: | -9.98% | |
| Price / MA100: | +1.49% | |
| Price / MAexp7: | -9.92% | |
| Price / MAexp20: | -12.30% | |
| Price / MAexp50: | -9.43% | |
| Price / MAexp100: | -11.05% |
News
The last news published on DRAFTKINGS INC. at the time of the generation of this analysis was as follows:
- Amazon Selects DraftKings as a Sponsor and the Exclusive Pregame and In-Game Odds Provider for Thursday Night Football on Prime Video
- Steve Aoki to Join DraftKings as Brand Ambassador for DraftKings Marketplace
- DraftKings Taps The Miz and Tony Hawk for its New Responsible Gaming Advertising Campaign: Practice Safe Bets
- DraftKings Announces Jason Park’s Participation in Upcoming Event
- DraftKings Slated to Launch Top-Rated Mobile Sportsbook in Kansas September 1
About author

Online


Add a comment
Comments
0 comments on the analysis DRAFTKINGS INC. - Daily