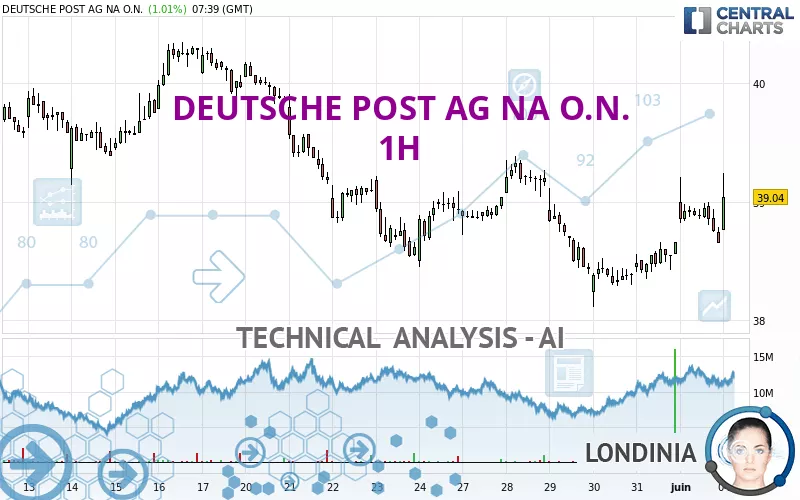
DEUTSCHE POST AG NA O.N. - 1H - Technical analysis published on 06/04/2024 (GMT)
- 129
- 0
Click here for a new analysis!
- Timeframe : 1H
- - Analysis generated on
- Status : INVALID
Summary of the analysis

Additional analysis
Quotes
The DEUTSCHE POST AG NA O.N. price is 39.09 EUR. The price has increased by +1.14% since the last closing and was between 38.76 EUR and 39.24 EUR. This implies that the price is at +0.85% from its lowest and at -0.38% from its highest.A study of price movements over other periods shows the following variations:
Near a new HIGH record (1 month)
Type : Bullish
Timeframe : Weekly
The Central Volumes scanner detects abnormal volumes on the asset:
Abnormal volumes
Timeframe : 5 days
Technical
Technical analysis of DEUTSCHE POST AG NA O.N. in 1H shows an overall slightly bullish trend. Only 60.71% of the signals given by moving averages are bullish. This slightly bullish trend is reinforced by the strong signals currently being given by short-term moving averages. An assessment of moving averages reveals several bullish signals that could impact this trend:
Bullish price crossover with Moving Average 20
Type : Bullish
Timeframe : 1 hour
Bullish price crossover with Moving Average 50
Type : Bullish
Timeframe : 1 hour
Bullish price crossover with Moving Average 100
Type : Bullish
Timeframe : 1 hour
Bullish price crossover with adaptative moving average 20
Type : Bullish
Timeframe : 1 hour
Bullish price crossover with adaptative moving average 50
Type : Bullish
Timeframe : 1 hour
Bullish price crossover with adaptative moving average 100
Type : Bullish
Timeframe : 1 hour
In fact, 14 technical indicators on 18 studied are currently positioned bullish. Caution: the Central Indicators scanner currently detects an excess:
CCI indicator is overbought : over 100
Type : Neutral
Timeframe : 1 hour
Williams %R indicator is overbought : over -20
Type : Neutral
Timeframe : 1 hour
Pivot points : price is over resistance 1
Type : Neutral
Timeframe : 1 hour
RSI indicator is back over 50
Type : Bullish
Timeframe : 1 hour
Parabolic SAR indicator bullish reversal
Type : Bullish
Timeframe : 1 hour
Ichimoku : price is over the cloud
Type : Bullish
Timeframe : 1 hour
The Central Patterns scanner, which studies chart patterns, resistances and supports, has identified this signal:
Near support of triangle
Type : Bullish
Timeframe : 1 hour
The presence of these bullish Japanese candlestick patterns detected by Central Candlesticks that could cause a very short term rebound were also noted:
White morning star
Type : Bullish
Timeframe : 1 hour
White line without lower shadow
Type : Bullish
Timeframe : 1 hour
Long white line
Type : Bullish
Timeframe : 1 hour
| S3 | S2 | S1 | Price | R1 | R2 | R3 | |
|---|---|---|---|---|---|---|---|
| ProTrendLines | 38.11 | 38.44 | 38.89 | 39.09 | 39.39 | 39.95 | 40.27 |
| Change (%) | -2.51% | -1.66% | -0.51% | - | +0.77% | +2.20% | +3.02% |
| Change | -0.98 | -0.65 | -0.20 | - | +0.30 | +0.86 | +1.18 |
| Level | Major | Major | Minor | - | Intermediate | Intermediate | Major |
Attention could also be paid to pivot points to set price objectives:
| Pivot points | S3 | S2 | S1 | PP | R1 | R2 | R3 |
|---|---|---|---|---|---|---|---|
| Standard | 37.90 | 38.28 | 38.46 | 38.84 | 39.02 | 39.40 | 39.58 |
| Camarilla | 38.50 | 38.55 | 38.60 | 38.65 | 38.70 | 38.75 | 38.80 |
| Woodie | 37.81 | 38.23 | 38.37 | 38.79 | 38.93 | 39.35 | 39.49 |
| Fibonacci | 38.28 | 38.49 | 38.62 | 38.84 | 39.05 | 39.18 | 39.40 |
| Pivot points | S3 | S2 | S1 | PP | R1 | R2 | R3 |
|---|---|---|---|---|---|---|---|
| Standard | 36.77 | 37.44 | 38.05 | 38.72 | 39.33 | 40.00 | 40.61 |
| Camarilla | 38.31 | 38.43 | 38.54 | 38.66 | 38.78 | 38.90 | 39.01 |
| Woodie | 36.74 | 37.43 | 38.02 | 38.71 | 39.30 | 39.99 | 40.58 |
| Fibonacci | 37.44 | 37.93 | 38.23 | 38.72 | 39.21 | 39.51 | 40.00 |
| Pivot points | S3 | S2 | S1 | PP | R1 | R2 | R3 |
|---|---|---|---|---|---|---|---|
| Standard | 34.04 | 35.64 | 37.15 | 38.75 | 40.26 | 41.86 | 43.37 |
| Camarilla | 37.81 | 38.09 | 38.38 | 38.66 | 38.95 | 39.23 | 39.52 |
| Woodie | 34.00 | 35.62 | 37.11 | 38.73 | 40.22 | 41.84 | 43.33 |
| Fibonacci | 35.64 | 36.83 | 37.56 | 38.75 | 39.94 | 40.67 | 41.86 |
Numerical data
The following is the status of technical indicators and moving averages registered at the time this technical analysis was created:
| RSI (14): | 65.74 | |
| MACD (12,26,9): | 0.0800 | |
| Directional Movement: | 21.96 | |
| AROON (14): | 78.57 | |
| DEMA (21): | 38.83 | |
| Parabolic SAR (0,02-0,02-0,2): | 38.65 | |
| Elder Ray (13): | 0.19 | |
| Super Trend (3,10): | 38.48 | |
| Zig ZAG (10): | 39.15 | |
| VORTEX (21): | 1.0300 | |
| Stochastique (14,3,5): | 52.73 | |
| TEMA (21): | 38.94 | |
| Williams %R (14): | -13.41 | |
| Chande Momentum Oscillator (20): | 0.57 | |
| Repulse (5,40,3): | 0.4400 | |
| ROCnROLL: | 1 | |
| TRIX (15,9): | 0.0100 | |
| Courbe Coppock: | 2.03 |
| MA7: | 38.78 | |
| MA20: | 39.15 | |
| MA50: | 38.10 | |
| MA100: | 39.27 | |
| MAexp7: | 38.86 | |
| MAexp20: | 38.76 | |
| MAexp50: | 38.77 | |
| MAexp100: | 38.86 | |
| Price / MA7: | +0.80% | |
| Price / MA20: | -0.15% | |
| Price / MA50: | +2.60% | |
| Price / MA100: | -0.46% | |
| Price / MAexp7: | +0.59% | |
| Price / MAexp20: | +0.85% | |
| Price / MAexp50: | +0.83% | |
| Price / MAexp100: | +0.59% |
News
The latest news and videos published on DEUTSCHE POST AG NA O.N. at the time of the analysis were as follows:
- EQS-News: Form notification of share repurchase programme
- EQS-News: FORM NOTIFICATION OF SHARE REPURCHASE PROGRAMME
- EQS-News: Form notification of share repurchase programme
- EQS-News: Deutsche Post AG: Form notification of share repurchase programme
- EQS-Adhoc: Deutsche Post AG to rename Group to ‘DHL Group’
About author
Online


Add a comment
Comments
0 comments on the analysis DEUTSCHE POST AG NA O.N. - 1H