DEUTSCHE POST AG NA O.N. - Daily - Technical analysis published on 02/23/2024 (GMT)
- 147
- 0
- Timeframe : Daily
- - Analysis generated on
- Status : NEUTRAL
Summary of the analysis

Additional analysis
Quotes
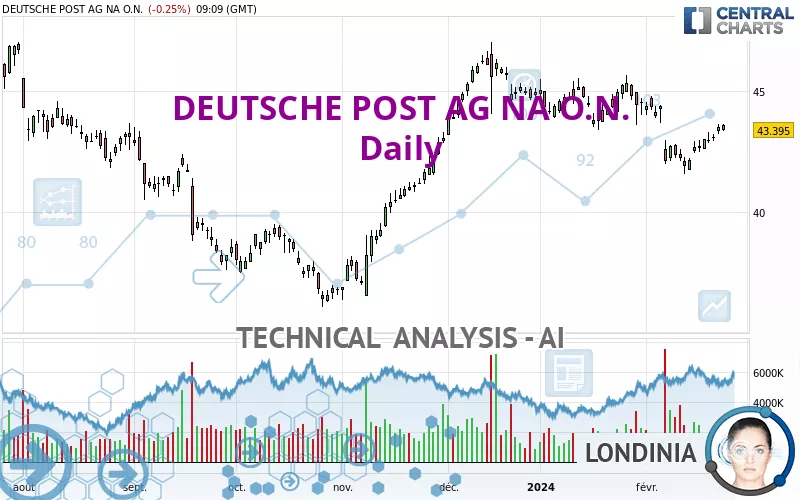
The DEUTSCHE POST AG NA O.N. rating is 43.395 EUR. The price is lower by -0.25% since the last closing and was between 43.355 EUR and 43.655 EUR. This implies that the price is at +0.09% from its lowest and at -0.60% from its highest.So that you have an overall view of the price change, here is a table showing the variations over several periods:
Near a new HIGH record (1st january)
Type : Bullish
Timeframe : Weekly
Near a new HIGH record (1 month)
Type : Bullish
Timeframe : Weekly
Technical
Technical analysis of this Daily chart of DEUTSCHE POST AG NA O.N. indicates that the overall trend is slightly bullish. Only 53.57% of the signals given by moving averages are bullish. This slightly bullish trend could return to neutral given the neutral signals also given by short-term moving averages. An assessment of moving averages reveals a bullish signal that could impact this trend:
Bullish trend reversal : adaptative moving average 20
Type : Bullish
Timeframe : Daily
An assessment of technical indicators shows a moderate bullish signal.
Caution: the Central Indicators scanner currently detects an excess:
RSI indicator: bearish divergence
Type : Bearish
Timeframe : Daily
Pivot points : price is over resistance 1
Type : Neutral
Timeframe : Weekly
RSI indicator is back under 50
Type : Bearish
Timeframe : Daily
Parabolic SAR indicator bullish reversal
Type : Bullish
Timeframe : Daily
Price is back under the pivot point
Type : Bearish
Timeframe : Daily
Momentum indicator is back over 0
Type : Bullish
Timeframe : Daily
An analysis of the price chart with the Central Patterns scanner (detector of chart patterns and resistances and supports) shows a result that can have an impact on the price change:
Near resistance of channel
Type : Bearish
Timeframe : Daily
The Central Candlesticks scanner, specialised in Japanese candlesticks, did not identify any signals.
| S3 | S2 | S1 | Price | R1 | R2 | R3 | |
|---|---|---|---|---|---|---|---|
| ProTrendLines | 37.898 | 39.964 | 41.853 | 43.395 | 44.240 | 45.349 | 46.890 |
| Change (%) | -12.67% | -7.91% | -3.55% | - | +1.95% | +4.50% | +8.05% |
| Change | -5.497 | -3.431 | -1.542 | - | +0.845 | +1.954 | +3.495 |
| Level | Minor | Major | Major | - | Intermediate | Intermediate | Major |
Attention could also be paid to pivot points to set price objectives:
| Pivot points | S3 | S2 | S1 | PP | R1 | R2 | R3 |
|---|---|---|---|---|---|---|---|
| Standard | 42.827 | 43.018 | 43.262 | 43.453 | 43.697 | 43.888 | 44.132 |
| Camarilla | 43.385 | 43.425 | 43.465 | 43.505 | 43.545 | 43.585 | 43.625 |
| Woodie | 42.853 | 43.031 | 43.288 | 43.466 | 43.723 | 43.901 | 44.158 |
| Fibonacci | 43.018 | 43.185 | 43.287 | 43.453 | 43.620 | 43.722 | 43.888 |
| Pivot points | S3 | S2 | S1 | PP | R1 | R2 | R3 |
|---|---|---|---|---|---|---|---|
| Standard | 40.473 | 41.017 | 41.868 | 42.412 | 43.263 | 43.807 | 44.658 |
| Camarilla | 42.336 | 42.464 | 42.592 | 42.720 | 42.848 | 42.976 | 43.104 |
| Woodie | 40.628 | 41.094 | 42.023 | 42.489 | 43.418 | 43.884 | 44.813 |
| Fibonacci | 41.017 | 41.550 | 41.879 | 42.412 | 42.945 | 43.274 | 43.807 |
| Pivot points | S3 | S2 | S1 | PP | R1 | R2 | R3 |
|---|---|---|---|---|---|---|---|
| Standard | 41.110 | 42.250 | 43.385 | 44.525 | 45.660 | 46.800 | 47.935 |
| Camarilla | 43.894 | 44.103 | 44.312 | 44.520 | 44.729 | 44.937 | 45.146 |
| Woodie | 41.108 | 42.249 | 43.383 | 44.524 | 45.658 | 46.799 | 47.933 |
| Fibonacci | 42.250 | 43.119 | 43.656 | 44.525 | 45.394 | 45.931 | 46.800 |
Numerical data
The following is the status of the technical indicators and moving averages at the time of publication of this technical analysis:
| RSI (14): | 49.47 | |
| MACD (12,26,9): | -0.3000 | |
| Directional Movement: | -3.253 | |
| AROON (14): | -35.714 | |
| DEMA (21): | 42.854 | |
| Parabolic SAR (0,02-0,02-0,2): | 41.560 | |
| Elder Ray (13): | 0.390 | |
| Super Trend (3,10): | 44.277 | |
| Zig ZAG (10): | 43.380 | |
| VORTEX (21): | 0.8740 | |
| Stochastique (14,3,5): | 59.20 | |
| TEMA (21): | 42.649 | |
| Williams %R (14): | -36.57 | |
| Chande Momentum Oscillator (20): | 1.295 | |
| Repulse (5,40,3): | -0.1210 | |
| ROCnROLL: | 1 | |
| TRIX (15,9): | -0.1460 | |
| Courbe Coppock: | 4.89 |
| MA7: | 43.033 | |
| MA20: | 43.279 | |
| MA50: | 44.225 | |
| MA100: | 42.110 | |
| MAexp7: | 43.112 | |
| MAexp20: | 43.279 | |
| MAexp50: | 43.429 | |
| MAexp100: | 42.910 | |
| Price / MA7: | +0.84% | |
| Price / MA20: | +0.27% | |
| Price / MA50: | -1.88% | |
| Price / MA100: | +3.05% | |
| Price / MAexp7: | +0.66% | |
| Price / MAexp20: | +0.27% | |
| Price / MAexp50: | -0.08% | |
| Price / MAexp100: | +1.13% |
News
The latest news and videos published on DEUTSCHE POST AG NA O.N. at the time of the analysis were as follows:
- EQS-News: Form notification of share repurchase programme
- EQS-News: Deutsche Post AG: Form notification of share repurchase programme
- EQS-Adhoc: Deutsche Post AG to rename Group to ‘DHL Group’
- EQS-News: Deutsche Post AG: Announcement pursuant to Art. 5 para 1 of Regulation (EU) No. 596/2014 in conjunction with Art. 2 para 1 of the Delegated Regulation (EU) 2016/1052 of the Commission (as amended or r
- EQS-News: DeutAnnouncement pursuant to Art. 5 para 1 of Regulation (EU) No. 596/2014 in conjunction with Art. 2 para 1 of the Delegated Regulation (EU) 2016/1052 of the Commission (as amended or rsche Post AG:
About author
Online


Add a comment
Comments
0 comments on the analysis DEUTSCHE POST AG NA O.N. - Daily