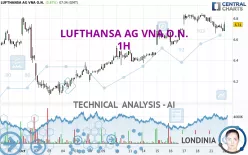
LUFTHANSA AG VNA O.N. - 1H - Technical analysis published on 10/22/2024 (GMT)
- 240
- 0
Click here for a new analysis!
- Timeframe : 1H
- - Analysis generated on
- Status : INVALID

Summary of the analysis

Additional analysis
Quotes
The LUFTHANSA AG VNA O.N. rating is 6.740 EUR. The price registered an increase of +0.87% on the session with the lowest point at 6.680 EUR and the highest point at 6.766 EUR. The deviation from the price is +0.90% for the low point and -0.38% for the high point.A bearish opening was detected by the Central Gaps scanner. Sellers are trying to impose a bearish trend in the very short term.
Bearish opening
Type : Bearish
Timeframe : Openning
So that you have an overall view of the price change, here is a table showing the variations over several periods:
Near a new HIGH record (1 month)
Type : Bullish
Timeframe : Weekly
Technical
Technical analysis of this 1H chart of LUFTHANSA AG VNA O.N. indicates that the overall trend is bullish. 75.00% of the signals given by moving averages are bullish. Caution: the neutral signals currently given by short-term moving averages show us that the global trend is losing momentum. The Central Indicators market scanner is currently detecting several bullish signals that could impact this trend:
Bullish price crossover with Moving Average 50
Type : Bullish
Timeframe : 1 hour
Bullish price crossover with adaptative moving average 20
Type : Bullish
Timeframe : 1 hour
Bullish price crossover with adaptative moving average 50
Type : Bullish
Timeframe : 1 hour
Bullish price crossover with adaptative moving average 100
Type : Bullish
Timeframe : 1 hour
An assessment of technical indicators shows a slightly bullish signal.
Central Indicators, the scanner specialised in technical indicators, has identified these signals:
RSI indicator is back over 50
Type : Bullish
Timeframe : 1 hour
Parabolic SAR indicator bullish reversal
Type : Bullish
Timeframe : 1 hour
Williams %R indicator is back over -50
Type : Bullish
Timeframe : 1 hour
The Central Patterns scanner, which studies chart patterns, resistances and supports, has identified these signals:
Near horizontal support
Type : Bullish
Timeframe : 1 hour
Near support of channel
Type : Bullish
Timeframe : 1 hour
For a small rebound in the very short term, the Central Candlesticks scanner currently notes the presence of this bullish pattern in Japanese candlesticks:
Bullish engulfing lines
Type : Bullish
Timeframe : 1 hour
| S3 | S2 | S1 | Price | R1 | R2 | R3 | |
|---|---|---|---|---|---|---|---|
| ProTrendLines | 6.537 | 6.676 | 6.738 | 6.740 | 6.845 | 7.173 | 7.517 |
| Change (%) | -3.01% | -0.95% | -0.03% | - | +1.56% | +6.42% | +11.53% |
| Change | -0.203 | -0.064 | -0.002 | - | +0.105 | +0.433 | +0.777 |
| Level | Intermediate | Minor | Minor | - | Major | Minor | Major |
Pivot points can also be used to set your price objectives. Here is the price situation in relation to pivot points:
| Pivot points | S3 | S2 | S1 | PP | R1 | R2 | R3 |
|---|---|---|---|---|---|---|---|
| Standard | 6.459 | 6.557 | 6.619 | 6.717 | 6.779 | 6.877 | 6.939 |
| Camarilla | 6.638 | 6.653 | 6.667 | 6.682 | 6.697 | 6.711 | 6.726 |
| Woodie | 6.442 | 6.548 | 6.602 | 6.708 | 6.762 | 6.868 | 6.922 |
| Fibonacci | 6.557 | 6.618 | 6.656 | 6.717 | 6.778 | 6.816 | 6.877 |
| Pivot points | S3 | S2 | S1 | PP | R1 | R2 | R3 |
|---|---|---|---|---|---|---|---|
| Standard | 5.997 | 6.185 | 6.475 | 6.663 | 6.953 | 7.141 | 7.431 |
| Camarilla | 6.635 | 6.678 | 6.722 | 6.766 | 6.810 | 6.854 | 6.898 |
| Woodie | 6.049 | 6.211 | 6.527 | 6.689 | 7.005 | 7.167 | 7.483 |
| Fibonacci | 6.185 | 6.367 | 6.480 | 6.663 | 6.845 | 6.958 | 7.141 |
| Pivot points | S3 | S2 | S1 | PP | R1 | R2 | R3 |
|---|---|---|---|---|---|---|---|
| Standard | 4.893 | 5.275 | 5.927 | 6.309 | 6.961 | 7.343 | 7.995 |
| Camarilla | 6.296 | 6.390 | 6.485 | 6.580 | 6.675 | 6.770 | 6.864 |
| Woodie | 5.029 | 5.343 | 6.063 | 6.377 | 7.097 | 7.411 | 8.131 |
| Fibonacci | 5.275 | 5.670 | 5.914 | 6.309 | 6.704 | 6.948 | 7.343 |
Numerical data
The following is the status of the technical indicators and moving averages at the time of publication of this technical analysis:
| RSI (14): | 54.41 | |
| MACD (12,26,9): | 0.0010 | |
| Directional Movement: | -1.321 | |
| AROON (14): | -57.143 | |
| DEMA (21): | 6.752 | |
| Parabolic SAR (0,02-0,02-0,2): | 6.654 | |
| Elder Ray (13): | -0.016 | |
| Super Trend (3,10): | 6.814 | |
| Zig ZAG (10): | 6.752 | |
| VORTEX (21): | 0.8530 | |
| Stochastique (14,3,5): | 33.57 | |
| TEMA (21): | 6.712 | |
| Williams %R (14): | -42.22 | |
| Chande Momentum Oscillator (20): | -0.020 | |
| Repulse (5,40,3): | 0.8570 | |
| ROCnROLL: | 1 | |
| TRIX (15,9): | 0.0290 | |
| Courbe Coppock: | 2.59 |
| MA7: | 6.693 | |
| MA20: | 6.492 | |
| MA50: | 6.107 | |
| MA100: | 5.978 | |
| MAexp7: | 6.727 | |
| MAexp20: | 6.742 | |
| MAexp50: | 6.687 | |
| MAexp100: | 6.583 | |
| Price / MA7: | +0.70% | |
| Price / MA20: | +3.82% | |
| Price / MA50: | +10.37% | |
| Price / MA100: | +12.75% | |
| Price / MAexp7: | +0.19% | |
| Price / MAexp20: | -0.03% | |
| Price / MAexp50: | +0.79% | |
| Price / MAexp100: | +2.38% |
News
Don't forget to follow the news on LUFTHANSA AG VNA O.N.. At the time of publication of this analysis, the latest news was as follows:
-
 Lufthansa hit with record penalty after barring Jewish passengers. #Lufthansa #US #BBCNews
- Lufthansa Technik, Boeing Sign License Agreement for 787 Dreamliner Cabin Modifications
- EQS-Adhoc: Deutsche Lufthansa AG: Lufthansa Group adjusts full-year guidance
- EQS-Adhoc: Deutsche Lufthansa AG: Lufthansa Group reports impact of strikes on results and adjusts full-year outlook accordingly
-
German train drivers strike coincides with Lufthansa cabin crew walkout
About author
Online


Add a comment
Comments
0 comments on the analysis LUFTHANSA AG VNA O.N. - 1H