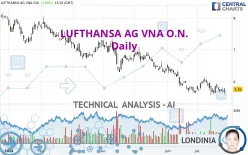
LUFTHANSA AG VNA O.N. - Daily - Technical analysis published on 07/25/2024 (GMT)
- 143
- 0
Click here for a new analysis!
- Timeframe : Daily
- - Analysis generated on
- Status : TARGET REACHED

Summary of the analysis

Additional analysis
Quotes
The LUFTHANSA AG VNA O.N. rating is 5.758 EUR. The price has increased by +1.05% since the last closing and was traded between 5.594 EUR and 5.800 EUR over the period. The price is currently at +2.93% from its lowest and -0.72% from its highest.The Central Gaps scanner detects the formation of a bearish gap marking the strong presence of sellers ahead of buyers at the opening. This formed a quotation gap.
Opening Gap DOWN
Type : Bearish
Timeframe : Openning
A study of price movements over other periods shows the following variations:
Near a new LOW record (1 year)
Type : Bearish
Timeframe : Weekly
Near a new LOW record (1st january)
Type : Bearish
Timeframe : Weekly
Near a new LOW record (1 month)
Type : Bearish
Timeframe : Weekly
Technical
Technical analysis of LUFTHANSA AG VNA O.N. in Daily shows a overall strongly bearish trend. 89.29% of the signals given by moving averages are bearish. This strongly bearish trend is showing signs of slowing down given the slightly bearish signals given by short-term moving averages. There is no crossing of moving average by the price or crossing of moving averages between themselves.
An assessment of technical indicators shows a slightly bullish signal.
Caution: the Central Indicators scanner currently detects an excess:
MACD indicator: bullish divergence
Type : Bullish
Timeframe : Daily
Price is back over the pivot point
Type : Bullish
Timeframe : Daily
The Central Patterns scanner, which studies chart patterns, resistances and supports, has identified this signal:
Near support of triangle
Type : Bullish
Timeframe : Daily
No result was found by the Central Candlesticks scanner on Japanese candlesticks.
| S3 | S2 | S1 | Price | R1 | R2 | R3 | |
|---|---|---|---|---|---|---|---|
| ProTrendLines | 4.836 | 5.292 | 5.650 | 5.758 | 6.027 | 6.845 | 7.465 |
| Change (%) | -16.01% | -8.09% | -1.88% | - | +4.67% | +18.88% | +29.65% |
| Change | -0.922 | -0.466 | -0.108 | - | +0.269 | +1.087 | +1.707 |
| Level | Intermediate | Intermediate | Major | - | Intermediate | Intermediate | Intermediate |
Pivot points can also be used to set your price objectives. Here is the price situation in relation to pivot points:
| Pivot points | S3 | S2 | S1 | PP | R1 | R2 | R3 |
|---|---|---|---|---|---|---|---|
| Standard | 5.515 | 5.597 | 5.647 | 5.729 | 5.779 | 5.861 | 5.911 |
| Camarilla | 5.662 | 5.674 | 5.686 | 5.698 | 5.710 | 5.722 | 5.734 |
| Woodie | 5.500 | 5.589 | 5.632 | 5.721 | 5.764 | 5.853 | 5.896 |
| Fibonacci | 5.597 | 5.647 | 5.678 | 5.729 | 5.779 | 5.810 | 5.861 |
| Pivot points | S3 | S2 | S1 | PP | R1 | R2 | R3 |
|---|---|---|---|---|---|---|---|
| Standard | 5.249 | 5.421 | 5.597 | 5.769 | 5.945 | 6.117 | 6.293 |
| Camarilla | 5.676 | 5.708 | 5.740 | 5.772 | 5.804 | 5.836 | 5.868 |
| Woodie | 5.250 | 5.422 | 5.598 | 5.770 | 5.946 | 6.118 | 6.294 |
| Fibonacci | 5.421 | 5.554 | 5.636 | 5.769 | 5.902 | 5.984 | 6.117 |
| Pivot points | S3 | S2 | S1 | PP | R1 | R2 | R3 |
|---|---|---|---|---|---|---|---|
| Standard | 4.425 | 5.019 | 5.365 | 5.959 | 6.305 | 6.899 | 7.245 |
| Camarilla | 5.452 | 5.538 | 5.624 | 5.710 | 5.796 | 5.882 | 5.969 |
| Woodie | 4.300 | 4.957 | 5.240 | 5.897 | 6.180 | 6.837 | 7.120 |
| Fibonacci | 5.019 | 5.378 | 5.600 | 5.959 | 6.318 | 6.540 | 6.899 |
Numerical data
The following are the details of the technical indicators and moving averages that were collected to generate this technical analysis:
| RSI (14): | 45.55 | |
| MACD (12,26,9): | -0.0790 | |
| Directional Movement: | -9.394 | |
| AROON (14): | -28.571 | |
| DEMA (21): | 5.714 | |
| Parabolic SAR (0,02-0,02-0,2): | 5.959 | |
| Elder Ray (13): | -0.094 | |
| Super Trend (3,10): | 6.090 | |
| Zig ZAG (10): | 5.788 | |
| VORTEX (21): | 0.9160 | |
| Stochastique (14,3,5): | 27.60 | |
| TEMA (21): | 5.741 | |
| Williams %R (14): | -61.05 | |
| Chande Momentum Oscillator (20): | -0.176 | |
| Repulse (5,40,3): | 3.0500 | |
| ROCnROLL: | -1 | |
| TRIX (15,9): | -0.2030 | |
| Courbe Coppock: | 4.67 |
| MA7: | 5.773 | |
| MA20: | 5.830 | |
| MA50: | 6.047 | |
| MA100: | 6.325 | |
| MAexp7: | 5.763 | |
| MAexp20: | 5.828 | |
| MAexp50: | 6.023 | |
| MAexp100: | 6.306 | |
| Price / MA7: | -0.26% | |
| Price / MA20: | -1.23% | |
| Price / MA50: | -4.78% | |
| Price / MA100: | -8.96% | |
| Price / MAexp7: | -0.05% | |
| Price / MAexp20: | -1.17% | |
| Price / MAexp50: | -4.37% | |
| Price / MAexp100: | -8.66% |
News
The latest news and videos published on LUFTHANSA AG VNA O.N. at the time of the analysis were as follows:
- Lufthansa Technik, Boeing Sign License Agreement for 787 Dreamliner Cabin Modifications
- EQS-Adhoc: Deutsche Lufthansa AG: Lufthansa Group adjusts full-year guidance
- EQS-Adhoc: Deutsche Lufthansa AG: Lufthansa Group reports impact of strikes on results and adjusts full-year outlook accordingly
-
 German train drivers strike coincides with Lufthansa cabin crew walkout
-
German train drivers strike coincides with Lufthansa cabin crew walkout
About author
Online


Add a comment
Comments
0 comments on the analysis LUFTHANSA AG VNA O.N. - Daily