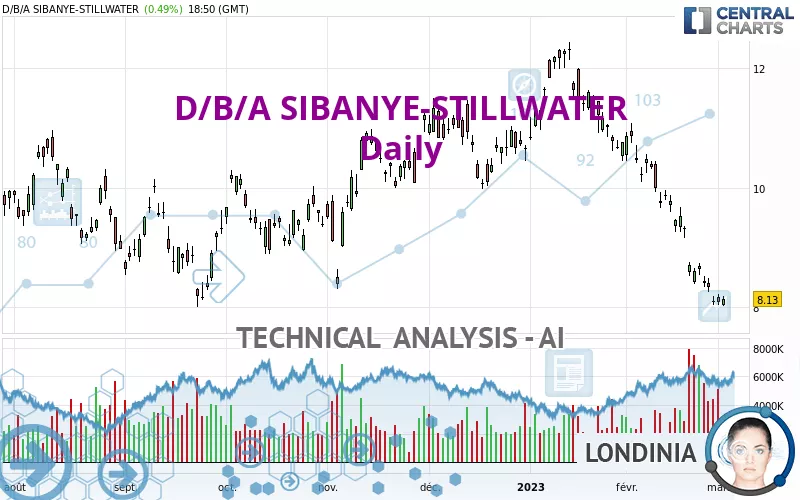
D/B/A SIBANYE-STILLWATER - Daily - Technical analysis published on 03/02/2023 (GMT)
- 155
- 0
Click here for a new analysis!
- Timeframe : Daily
- - Analysis generated on
- Status : LEVEL MAINTAINED
Summary of the analysis

Additional analysis
Quotes
The D/B/A SIBANYE-STILLWATER price is 8.13 USD. The price has increased by +0.49% since the last closing and was traded between 8.02 USD and 8.18 USD over the period. The price is currently at +1.37% from its lowest and -0.61% from its highest.The Central Gaps scanner detects a bearish opening. A small advantage for sellers in the very short term.
Bearish opening
Type : Bearish
Timeframe : Openning
Here is a more detailed summary of the historical variations registered by D/B/A SIBANYE-STILLWATER:
Near a new LOW record (1 year)
Type : Bearish
Timeframe : Weekly
New LOW record (1st january)
Type : Bearish
Timeframe : Weekly
New LOW record (1 month)
Type : Bearish
Timeframe : Weekly
Technical
Technical analysis of this Daily chart of D/B/A SIBANYE-STILLWATER indicates that the overall trend is strongly bearish. The signals given by moving averages are 89.29% bearish. This strong bearish trend is confirmed by the strong signals currently being given by short-term moving averages. The Central Indicators market scanner currently does not detect any result that concerns moving averages.
In fact, of the 18 technical indicators analysed by Central Analyzer, 4 are bullish, 2 are neutral and 12 are bearish. Caution: the Central Indicators scanner currently detects an excess:
CCI indicator is oversold : under -100
Type : Neutral
Timeframe : Daily
Williams %R indicator is oversold : under -80
Type : Neutral
Timeframe : Daily
Pivot points : price is under support 1
Type : Neutral
Timeframe : Weekly
Price is back over the pivot point
Type : Bullish
Timeframe : Daily
No signals are given by Central Patterns, a market scanner specialised in chart patterns, resistances and supports.
No result was found by the Central Candlesticks scanner on Japanese candlesticks.
| S3 | S2 | S1 | Price | R1 | R2 | R3 | |
|---|---|---|---|---|---|---|---|
| ProTrendLines | 1.78 | 3.23 | 5.10 | 8.13 | 8.69 | 9.74 | 10.68 |
| Change (%) | -78.11% | -60.27% | -37.27% | - | +6.89% | +19.80% | +31.37% |
| Change | -6.35 | -4.90 | -3.03 | - | +0.56 | +1.61 | +2.55 |
| Level | Minor | Major | Intermediate | - | Major | Intermediate | Major |
Attention could also be paid to pivot points to set price objectives:
| Pivot points | S3 | S2 | S1 | PP | R1 | R2 | R3 |
|---|---|---|---|---|---|---|---|
| Standard | 7.83 | 7.94 | 8.01 | 8.12 | 8.19 | 8.30 | 8.37 |
| Camarilla | 8.04 | 8.06 | 8.07 | 8.09 | 8.11 | 8.12 | 8.14 |
| Woodie | 7.82 | 7.93 | 8.00 | 8.11 | 8.18 | 8.29 | 8.36 |
| Fibonacci | 7.94 | 8.01 | 8.05 | 8.12 | 8.19 | 8.23 | 8.30 |
| Pivot points | S3 | S2 | S1 | PP | R1 | R2 | R3 |
|---|---|---|---|---|---|---|---|
| Standard | 7.84 | 8.09 | 8.26 | 8.51 | 8.68 | 8.93 | 9.10 |
| Camarilla | 8.33 | 8.36 | 8.40 | 8.44 | 8.48 | 8.52 | 8.56 |
| Woodie | 7.81 | 8.07 | 8.23 | 8.49 | 8.65 | 8.91 | 9.07 |
| Fibonacci | 8.09 | 8.25 | 8.35 | 8.51 | 8.67 | 8.77 | 8.93 |
| Pivot points | S3 | S2 | S1 | PP | R1 | R2 | R3 |
|---|---|---|---|---|---|---|---|
| Standard | 4.01 | 6.02 | 7.06 | 9.07 | 10.11 | 12.12 | 13.16 |
| Camarilla | 7.26 | 7.54 | 7.82 | 8.10 | 8.38 | 8.66 | 8.94 |
| Woodie | 3.53 | 5.78 | 6.58 | 8.83 | 9.63 | 11.88 | 12.68 |
| Fibonacci | 6.02 | 7.19 | 7.91 | 9.07 | 10.24 | 10.96 | 12.12 |
Numerical data
The following are the details of the technical indicators and moving averages that were collected to generate this technical analysis:
| RSI (14): | 20.82 | |
| MACD (12,26,9): | -0.7100 | |
| Directional Movement: | -28.88 | |
| AROON (14): | -100.00 | |
| DEMA (21): | 8.32 | |
| Parabolic SAR (0,02-0,02-0,2): | 8.52 | |
| Elder Ray (13): | -0.71 | |
| Super Trend (3,10): | 9.06 | |
| Zig ZAG (10): | 8.15 | |
| VORTEX (21): | 0.6100 | |
| Stochastique (14,3,5): | 4.10 | |
| TEMA (21): | 7.89 | |
| Williams %R (14): | -93.06 | |
| Chande Momentum Oscillator (20): | -1.73 | |
| Repulse (5,40,3): | 1.2400 | |
| ROCnROLL: | 2 | |
| TRIX (15,9): | -0.8500 | |
| Courbe Coppock: | 36.75 |
| MA7: | 8.34 | |
| MA20: | 9.36 | |
| MA50: | 10.46 | |
| MA100: | 10.27 | |
| MAexp7: | 8.39 | |
| MAexp20: | 9.20 | |
| MAexp50: | 9.96 | |
| MAexp100: | 10.26 | |
| Price / MA7: | -2.52% | |
| Price / MA20: | -13.14% | |
| Price / MA50: | -22.28% | |
| Price / MA100: | -20.84% | |
| Price / MAexp7: | -3.10% | |
| Price / MAexp20: | -11.63% | |
| Price / MAexp50: | -18.37% | |
| Price / MAexp100: | -20.76% |
About author

Online


Add a comment
Comments
0 comments on the analysis D/B/A SIBANYE-STILLWATER - Daily