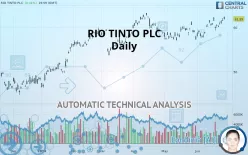
RIO TINTO PLC - Daily - Technical analysis published on 06/28/2019 (GMT)
- 281
- 0
- Who voted?
Click here for a new analysis!
- Timeframe : Daily
- - Analysis generated on
- Status : TARGET REACHED

Summary of the analysis

Additional analysis
Quotes
RIO TINTO PLC rating 61.95 USD. The price registered an increase of +0.41% on the session and was traded between 61.74 USD and 62.42 USD over the period. The price is currently at +0.34% from its lowest and -0.75% from its highest.The Central Gaps scanner detects a bullish gap which is a sign that buyers have taken the lead in the very short term.
Opening Gap UP
Type : Bullish
Timeframe : Openning
Here is a more detailed summary of the historical variations registered by RIO TINTO PLC:
Near a new HIGH record (5 years)
Type : Bullish
Timeframe : Weekly
Near a new HIGH record (1 year)
Type : Bullish
Timeframe : Weekly
Near a new HIGH record (1st january)
Type : Bullish
Timeframe : Weekly
Technical
Technical analysis of this Daily chart of RIO TINTO PLC indicates that the overall trend is strongly bullish. 92.86% of the signals given by moving averages are bullish. The overall trend is supported by the strong bullish signals from short-term moving averages. The Central Indicators market scanner currently does not detect any result that concerns moving averages.
Technical indicators are strongly bullish, suggesting that the price increase should continue.
Caution: the Central Indicators scanner currently detects an excess:
CCI indicator is overbought : over 100
Type : Neutral
Timeframe : Daily
Price is back under the pivot point
Type : Bearish
Timeframe : Weekly
The Central Patterns scanner, which studies chart patterns, resistances and supports, has identified these signals:
Near horizontal resistance
Type : Bearish
Timeframe : Daily
Near resistance of channel
Type : Bearish
Timeframe : Daily
Near resistance of triangle
Type : Bearish
Timeframe : Daily
No result was found by the Central Candlesticks scanner on Japanese candlesticks.
| S3 | S2 | S1 | Price | R1 | R2 | R3 | |
|---|---|---|---|---|---|---|---|
| ProTrendLines | 52.21 | 57.94 | 60.30 | 61.95 | 62.78 | 76.63 | 119.59 |
| Change (%) | -15.72% | -6.47% | -2.66% | - | +1.34% | +23.70% | +93.04% |
| Change | -9.74 | -4.01 | -1.65 | - | +0.83 | +14.68 | +57.64 |
| Level | Intermediate | Major | Major | - | Intermediate | Minor | Minor |
Pivot points can also be used to set your price objectives. Here is the price situation in relation to pivot points:
| Pivot points | S3 | S2 | S1 | PP | R1 | R2 | R3 |
|---|---|---|---|---|---|---|---|
| Standard | 60.73 | 61.10 | 61.40 | 61.77 | 62.07 | 62.44 | 62.74 |
| Camarilla | 61.52 | 61.58 | 61.64 | 61.70 | 61.76 | 61.82 | 61.88 |
| Woodie | 60.69 | 61.08 | 61.37 | 61.75 | 62.03 | 62.42 | 62.71 |
| Fibonacci | 61.10 | 61.36 | 61.51 | 61.77 | 62.03 | 62.18 | 62.44 |
| Pivot points | S3 | S2 | S1 | PP | R1 | R2 | R3 |
|---|---|---|---|---|---|---|---|
| Standard | 55.86 | 57.57 | 58.92 | 60.63 | 61.98 | 63.69 | 65.04 |
| Camarilla | 59.43 | 59.71 | 59.99 | 60.27 | 60.55 | 60.83 | 61.11 |
| Woodie | 55.68 | 57.48 | 58.74 | 60.54 | 61.80 | 63.60 | 64.86 |
| Fibonacci | 57.57 | 58.74 | 59.46 | 60.63 | 61.80 | 62.52 | 63.69 |
Numerical data
The following is the status of technical indicators and moving averages registered at the time this technical analysis was created:
| RSI (14): | 60.18 | |
| MACD (12,26,9): | 0.6200 | |
| Directional Movement: | 13.09 | |
| AROON (14): | 100.00 | |
| DEMA (21): | 61.15 | |
| Parabolic SAR (0,02-0,02-0,2): | 59.38 | |
| Elder Ray (13): | 1.32 | |
| Super Trend (3,10): | 58.79 | |
| Zig ZAG (10): | 61.95 | |
| VORTEX (21): | 0.9500 | |
| Stochastique (14,3,5): | 81.92 | |
| TEMA (21): | 61.51 | |
| Williams %R (14): | -12.07 | |
| Chande Momentum Oscillator (20): | 1.68 | |
| Repulse (5,40,3): | -1.1800 | |
| ROCnROLL: | 1 | |
| TRIX (15,9): | 0.1100 | |
| Courbe Coppock: | 7.94 |
| MA7: | 60.88 | |
| MA20: | 60.03 | |
| MA50: | 59.49 | |
| MA100: | 57.96 | |
| MAexp7: | 61.18 | |
| MAexp20: | 60.42 | |
| MAexp50: | 59.43 | |
| MAexp100: | 57.35 | |
| Price / MA7: | +1.76% | |
| Price / MA20: | +3.20% | |
| Price / MA50: | +4.14% | |
| Price / MA100: | +6.88% | |
| Price / MAexp7: | +1.26% | |
| Price / MAexp20: | +2.53% | |
| Price / MAexp50: | +4.24% | |
| Price / MAexp100: | +8.02% |
About author

Online


Add a comment
Comments
0 comments on the analysis RIO TINTO PLC - Daily