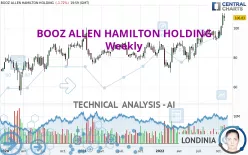
BOOZ ALLEN HAMILTON HOLDING - Weekly - Technical analysis published on 11/05/2022 (GMT)
- 162
- 0
Click here for a new analysis!
- Timeframe : Weekly
- - Analysis generated on
- Status : INVALID

Summary of the analysis

Additional analysis
Quotes
BOOZ ALLEN HAMILTON HOLDING rating 106.83 USD. The price registered a decrease of -1.70% over 5 days with the lowest point at 104.57 USD and the highest point at 109.93 USD. The deviation from the price is +2.16% for the low point and -2.82% for the high point.The Central Gaps scanner detects a bullish opening marking the presence of buyers ahead of sellers at the opening but not sufficiently marked to allow the price to register a quotation gap.
Bullish opening
Type : Bullish
Timeframe : Openning
Here is a more detailed summary of the historical variations registered by BOOZ ALLEN HAMILTON HOLDING:
Near a new HIGH record (5 years)
Type : Bullish
Timeframe : Weekly
Near a new HIGH record (1 year)
Type : Bullish
Timeframe : Weekly
Near a new HIGH record (1st january)
Type : Bullish
Timeframe : Weekly
Near a new HIGH record (1 month)
Type : Bullish
Timeframe : Weekly
Technical
Technical analysis of this Weekly chart of BOOZ ALLEN HAMILTON HOLDING indicates that the overall trend is strongly bullish. 92.86% of the signals given by moving averages are bullish. The overall trend is supported by the strong bullish signals from short-term moving averages. There is no crossing of moving average by the price or crossing of moving averages between themselves.
The probability of a further increase is high given the direction of the technical indicators.
Caution: the Central Indicators scanner currently detects an excess:
CCI indicator is overbought : over 100
Type : Neutral
Timeframe : Weekly
Previous candle closed over Bollinger bands
Type : Neutral
Timeframe : Weekly
Williams %R indicator is overbought : over -20
Type : Neutral
Timeframe : Weekly
An analysis of the price chart with the Central Patterns scanner (detector of chart patterns and resistances and supports) shows a result that can have an impact on the price change:
Resistance of channel is broken
Type : Bullish
Timeframe : Weekly
Central Candlesticks, the scanner specialised in Japanese candlesticks, detects a bearish signal that could support the hypothesis of a small drop in the very short term:
Bearish harami
Type : Bearish
Timeframe : Weekly
| S3 | S2 | S1 | Price | |
|---|---|---|---|---|
| ProTrendLines | 88.80 | 94.65 | 99.05 | 106.83 |
| Change (%) | -16.88% | -11.40% | -7.28% | - |
| Change | -18.03 | -12.18 | -7.78 | - |
| Level | Minor | Major | Major | - |
Attention could also be paid to pivot points to set price objectives:
| Pivot points | S3 | S2 | S1 | PP | R1 | R2 | R3 |
|---|---|---|---|---|---|---|---|
| Standard | 100.30 | 102.44 | 104.63 | 106.77 | 108.96 | 111.10 | 113.29 |
| Camarilla | 105.64 | 106.04 | 106.43 | 106.83 | 107.23 | 107.62 | 108.02 |
| Woodie | 100.34 | 102.45 | 104.67 | 106.78 | 109.00 | 111.11 | 113.33 |
| Fibonacci | 102.44 | 104.09 | 105.11 | 106.77 | 108.42 | 109.44 | 111.10 |
| Pivot points | S3 | S2 | S1 | PP | R1 | R2 | R3 |
|---|---|---|---|---|---|---|---|
| Standard | 92.24 | 96.09 | 102.38 | 106.23 | 112.52 | 116.37 | 122.66 |
| Camarilla | 105.89 | 106.82 | 107.75 | 108.68 | 109.61 | 110.54 | 111.47 |
| Woodie | 93.47 | 96.70 | 103.61 | 106.84 | 113.75 | 116.98 | 123.89 |
| Fibonacci | 96.09 | 99.96 | 102.35 | 106.23 | 110.10 | 112.49 | 116.37 |
| Pivot points | S3 | S2 | S1 | PP | R1 | R2 | R3 |
|---|---|---|---|---|---|---|---|
| Standard | 80.49 | 86.65 | 97.75 | 103.91 | 115.01 | 121.17 | 132.27 |
| Camarilla | 104.10 | 105.69 | 107.27 | 108.85 | 110.43 | 112.01 | 113.60 |
| Woodie | 82.96 | 87.89 | 100.22 | 105.15 | 117.48 | 122.41 | 134.74 |
| Fibonacci | 86.65 | 93.24 | 97.32 | 103.91 | 110.50 | 114.58 | 121.17 |
Numerical data
The following is the status of the technical indicators and moving averages at the time of publication of this technical analysis:
| RSI (14): | 65.48 | |
| MACD (12,26,9): | 4.3600 | |
| Directional Movement: | 21.89 | |
| AROON (14): | 28.57 | |
| DEMA (21): | 101.47 | |
| Parabolic SAR (0,02-0,02-0,2): | 92.24 | |
| Elder Ray (13): | 8.82 | |
| Super Trend (3,10): | 91.22 | |
| Zig ZAG (10): | 106.83 | |
| VORTEX (21): | 1.1900 | |
| Stochastique (14,3,5): | 90.71 | |
| TEMA (21): | 103.48 | |
| Williams %R (14): | -17.25 | |
| Chande Momentum Oscillator (20): | 10.99 | |
| Repulse (5,40,3): | 7.3100 | |
| ROCnROLL: | 1 | |
| TRIX (15,9): | 0.5700 | |
| Courbe Coppock: | 16.32 |
| MA7: | 107.62 | |
| MA20: | 101.64 | |
| MA50: | 97.83 | |
| MA100: | 95.10 | |
| MAexp7: | 101.33 | |
| MAexp20: | 96.06 | |
| MAexp50: | 90.34 | |
| MAexp100: | 85.04 | |
| Price / MA7: | -0.73% | |
| Price / MA20: | +5.11% | |
| Price / MA50: | +9.20% | |
| Price / MA100: | +12.33% | |
| Price / MAexp7: | +5.43% | |
| Price / MAexp20: | +11.21% | |
| Price / MAexp50: | +18.25% | |
| Price / MAexp100: | +25.62% |
News
The latest news and videos published on BOOZ ALLEN HAMILTON HOLDING at the time of the analysis were as follows:
- Booz Allen Hamilton Announces Second Quarter Fiscal 2023 Results
- Booz Allen Completes Acquisition of EverWatch
- Booz Allen Announces Creation of HELworks
- Elevate Security and Booz Allen Hamilton Partner to Address Human Cyber Risk
- Booz Allen Hamilton to Host Conference Call to Discuss Second Quarter Fiscal 2023 Results on Friday, October 28, 2022
About author

Online


Add a comment
Comments
0 comments on the analysis BOOZ ALLEN HAMILTON HOLDING - Weekly