BOOZ ALLEN HAMILTON HOLDING - Daily - Technical analysis published on 11/05/2022 (GMT)
- 154
- 0
Click here for a new analysis!
- Timeframe : Daily
- - Analysis generated on
- Status : LEVEL MAINTAINED
Summary of the analysis

Additional analysis
Quotes
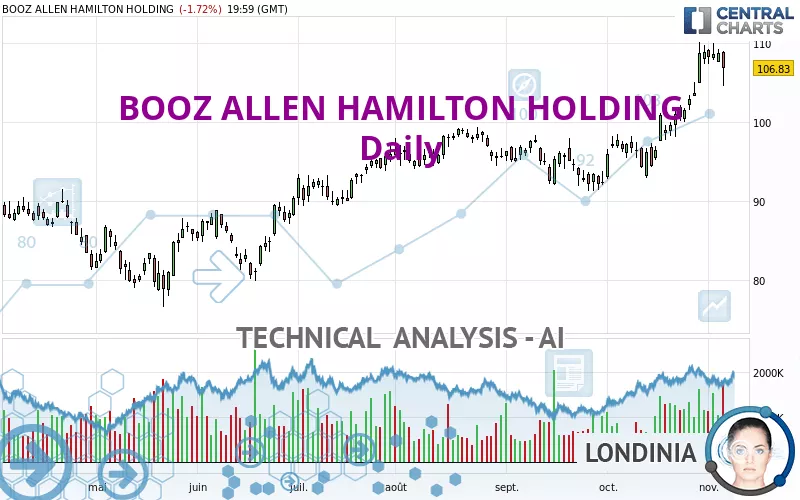
The BOOZ ALLEN HAMILTON HOLDING rating is 106.83 USD. On the day, this instrument lost -1.72% and was traded between 104.57 USD and 108.90 USD over the period. The price is currently at +2.16% from its lowest and -1.90% from its highest.A bullish opening was detected by the Central Gaps scanner. Buyers are trying to impose a bullish momentum in the very short term.
Bullish opening
Type : Bullish
Timeframe : Openning
So that you have an overall view of the price change, here is a table showing the variations over several periods:
Near a new HIGH record (5 years)
Type : Bullish
Timeframe : Weekly
Near a new HIGH record (1 year)
Type : Bullish
Timeframe : Weekly
Near a new HIGH record (1st january)
Type : Bullish
Timeframe : Weekly
Near a new HIGH record (1 month)
Type : Bullish
Timeframe : Weekly
Technical
A technical analysis in Daily of this BOOZ ALLEN HAMILTON HOLDING chart shows a strongly bullish trend. 92.86% of the signals given by moving averages are bullish. This strongly bullish trend is supported by the strong bullish signals given by short-term moving averages. The Central Indicators market scanner is currently detecting a bearish signal that could impact this trend:
Moving Average bearish crossovers : AMA50 & AMA100
Type : Bearish
Timeframe : Daily
The probability of a further increase are moderate given the direction of the technical indicators.
Caution: the Central Indicators scanner currently detects an excess:
RSI indicator: bearish divergence
Type : Bearish
Timeframe : Daily
Pivot points : price is under support 1
Type : Neutral
Timeframe : Daily
Central Patterns, the scanner specializing in chart patterns, did not identify any signals.
The presence of a bearish pattern in Japanese candlesticks detected by Central Candlesticks that could cause a correction in the very short term was also detected:
Bearish engulfing lines
Type : Bearish
Timeframe : Daily
| S3 | S2 | S1 | Price | |
|---|---|---|---|---|
| ProTrendLines | 92.23 | 94.65 | 99.05 | 106.83 |
| Change (%) | -13.67% | -11.40% | -7.28% | - |
| Change | -14.60 | -12.18 | -7.78 | - |
| Level | Major | Major | Major | - |
To determine price objectives, it is also possible to use the pivot points. Here is the price position in relation to pivot points:
| Pivot points | S3 | S2 | S1 | PP | R1 | R2 | R3 |
|---|---|---|---|---|---|---|---|
| Standard | 100.30 | 102.44 | 104.63 | 106.77 | 108.96 | 111.10 | 113.29 |
| Camarilla | 105.64 | 106.04 | 106.43 | 106.83 | 107.23 | 107.62 | 108.02 |
| Woodie | 100.34 | 102.45 | 104.67 | 106.78 | 109.00 | 111.11 | 113.33 |
| Fibonacci | 102.44 | 104.09 | 105.11 | 106.77 | 108.42 | 109.44 | 111.10 |
| Pivot points | S3 | S2 | S1 | PP | R1 | R2 | R3 |
|---|---|---|---|---|---|---|---|
| Standard | 98.93 | 101.75 | 104.29 | 107.11 | 109.65 | 112.47 | 115.01 |
| Camarilla | 105.36 | 105.85 | 106.34 | 106.83 | 107.32 | 107.81 | 108.30 |
| Woodie | 98.79 | 101.68 | 104.15 | 107.04 | 109.51 | 112.40 | 114.87 |
| Fibonacci | 101.75 | 103.80 | 105.06 | 107.11 | 109.16 | 110.42 | 112.47 |
| Pivot points | S3 | S2 | S1 | PP | R1 | R2 | R3 |
|---|---|---|---|---|---|---|---|
| Standard | 80.49 | 86.65 | 97.75 | 103.91 | 115.01 | 121.17 | 132.27 |
| Camarilla | 104.10 | 105.69 | 107.27 | 108.85 | 110.43 | 112.01 | 113.60 |
| Woodie | 82.96 | 87.89 | 100.22 | 105.15 | 117.48 | 122.41 | 134.74 |
| Fibonacci | 86.65 | 93.24 | 97.32 | 103.91 | 110.50 | 114.58 | 121.17 |
Numerical data
The following is the status of technical indicators and moving averages registered at the time this technical analysis was created:
| RSI (14): | 65.05 | |
| MACD (12,26,9): | 3.3000 | |
| Directional Movement: | 14.56 | |
| AROON (14): | 64.29 | |
| DEMA (21): | 106.97 | |
| Parabolic SAR (0,02-0,02-0,2): | 102.81 | |
| Elder Ray (13): | 1.89 | |
| Super Trend (3,10): | 100.96 | |
| Zig ZAG (10): | 106.83 | |
| VORTEX (21): | 1.0600 | |
| Stochastique (14,3,5): | 85.05 | |
| TEMA (21): | 109.02 | |
| Williams %R (14): | -25.84 | |
| Chande Momentum Oscillator (20): | 8.21 | |
| Repulse (5,40,3): | 0.2100 | |
| ROCnROLL: | 1 | |
| TRIX (15,9): | 0.3800 | |
| Courbe Coppock: | 21.59 |
| MA7: | 107.62 | |
| MA20: | 101.64 | |
| MA50: | 97.83 | |
| MA100: | 95.10 | |
| MAexp7: | 106.84 | |
| MAexp20: | 103.01 | |
| MAexp50: | 99.07 | |
| MAexp100: | 95.57 | |
| Price / MA7: | -0.73% | |
| Price / MA20: | +5.11% | |
| Price / MA50: | +9.20% | |
| Price / MA100: | +12.33% | |
| Price / MAexp7: | -0.01% | |
| Price / MAexp20: | +3.71% | |
| Price / MAexp50: | +7.83% | |
| Price / MAexp100: | +11.78% |
News
The latest news and videos published on BOOZ ALLEN HAMILTON HOLDING at the time of the analysis were as follows:
- Booz Allen Hamilton Announces Second Quarter Fiscal 2023 Results
- Booz Allen Completes Acquisition of EverWatch
- Booz Allen Announces Creation of HELworks
- Elevate Security and Booz Allen Hamilton Partner to Address Human Cyber Risk
- Booz Allen Hamilton to Host Conference Call to Discuss Second Quarter Fiscal 2023 Results on Friday, October 28, 2022
About author

Online


Add a comment
Comments
0 comments on the analysis BOOZ ALLEN HAMILTON HOLDING - Daily