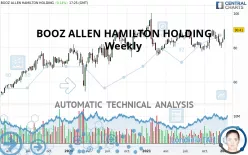
BOOZ ALLEN HAMILTON HOLDING - Weekly - Technical analysis published on 01/05/2022 (GMT)
- 200
- 0
Click here for a new analysis!
- Timeframe : Weekly
- - Analysis generated on
- Status : INVALID

Summary of the analysis

Additional analysis
Quotes
BOOZ ALLEN HAMILTON HOLDING rating 90.41 USD. The price registered an increase of +6.15% over 5 days with the lowest point at 84.89 USD and the highest point at 88.32 USD. The deviation from the price is +6.50% for the low point and +2.37% for the high point.A bearish opening was detected by the Central Gaps scanner. Sellers are trying to impose a bearish trend in the very short term.
Bearish opening
Type : Bearish
Timeframe : Openning
So that you have an overall view of the price change, here is a table showing the variations over several periods:
Near a new HIGH record (1st january)
Type : Bullish
Timeframe : Weekly
Near a new HIGH record (1 month)
Type : Bullish
Timeframe : Weekly
Technical
A technical analysis in Weekly of this BOOZ ALLEN HAMILTON HOLDING chart shows a strongly bullish trend. 85.71% of the signals given by moving averages are bullish. The overall trend is supported by the strong bullish signals from short-term moving averages. The Central Indicators market scanner is currently detecting several bullish signals that could impact this trend:
Bullish trend reversal : adaptative moving average 20
Type : Bullish
Timeframe : Weekly
Moving Average bullish crossovers : MA20 & MA50
Type : Bullish
Timeframe : Weekly
Bullish price crossover with Moving Average 50
Type : Bullish
Timeframe : Weekly
Bullish price crossover with adaptative moving average 20
Type : Bullish
Timeframe : Weekly
The probability of a further increase is high given the direction of the technical indicators.
Caution: the Central Indicators scanner currently detects an excess:
MACD indicator: bullish divergence
Type : Bullish
Timeframe : Weekly
Pivot points : price is over resistance 3
Type : Neutral
Timeframe : Weekly
RSI indicator is back over 50
Type : Bullish
Timeframe : Weekly
Williams %R indicator is back over -50
Type : Bullish
Timeframe : Weekly
The Central Patterns scanner, which studies chart patterns, resistances and supports, has identified this signal:
Near horizontal support
Type : Bullish
Timeframe : Weekly
The Central Candlesticks scanner, specialised in Japanese candlesticks, did not identify any signals.
| S3 | S2 | S1 | Price | R1 | |
|---|---|---|---|---|---|
| ProTrendLines | 76.82 | 85.11 | 89.92 | 90.41 | 97.84 |
| Change (%) | -15.03% | -5.86% | -0.54% | - | +8.22% |
| Change | -13.59 | -5.30 | -0.49 | - | +7.43 |
| Level | Major | Intermediate | Major | - | Major |
Attention could also be paid to pivot points to set price objectives:
| Pivot points | S3 | S2 | S1 | PP | R1 | R2 | R3 |
|---|---|---|---|---|---|---|---|
| Standard | 86.40 | 87.47 | 88.87 | 89.94 | 91.34 | 92.41 | 93.81 |
| Camarilla | 89.60 | 89.83 | 90.05 | 90.28 | 90.51 | 90.73 | 90.96 |
| Woodie | 86.58 | 87.55 | 89.05 | 90.02 | 91.52 | 92.49 | 93.99 |
| Fibonacci | 87.47 | 88.41 | 88.99 | 89.94 | 90.88 | 91.46 | 92.41 |
| Pivot points | S3 | S2 | S1 | PP | R1 | R2 | R3 |
|---|---|---|---|---|---|---|---|
| Standard | 80.10 | 81.47 | 83.13 | 84.50 | 86.16 | 87.53 | 89.19 |
| Camarilla | 83.96 | 84.24 | 84.51 | 84.79 | 85.07 | 85.35 | 85.62 |
| Woodie | 80.25 | 81.54 | 83.28 | 84.57 | 86.31 | 87.60 | 89.34 |
| Fibonacci | 81.47 | 82.63 | 83.34 | 84.50 | 85.66 | 86.37 | 87.53 |
| Pivot points | S3 | S2 | S1 | PP | R1 | R2 | R3 |
|---|---|---|---|---|---|---|---|
| Standard | 72.03 | 75.94 | 80.36 | 84.27 | 88.69 | 92.60 | 97.02 |
| Camarilla | 82.50 | 83.26 | 84.03 | 84.79 | 85.55 | 86.32 | 87.08 |
| Woodie | 72.30 | 76.07 | 80.63 | 84.40 | 88.96 | 92.73 | 97.29 |
| Fibonacci | 75.94 | 79.12 | 81.09 | 84.27 | 87.45 | 89.42 | 92.60 |
Numerical data
The following is the status of the technical indicators and moving averages at the time of publication of this technical analysis:
| RSI (14): | 62.94 | |
| MACD (12,26,9): | 0.8500 | |
| Directional Movement: | 11.62 | |
| AROON (14): | 100.00 | |
| DEMA (21): | 85.48 | |
| Parabolic SAR (0,02-0,02-0,2): | 79.84 | |
| Elder Ray (13): | 2.94 | |
| Super Trend (3,10): | 77.92 | |
| Zig ZAG (10): | 90.40 | |
| VORTEX (21): | 1.0700 | |
| Stochastique (14,3,5): | 64.74 | |
| TEMA (21): | 85.97 | |
| Williams %R (14): | -4.39 | |
| Chande Momentum Oscillator (20): | 9.86 | |
| Repulse (5,40,3): | 8.4200 | |
| ROCnROLL: | 1 | |
| TRIX (15,9): | 0.0700 | |
| Courbe Coppock: | 11.90 |
| MA7: | 86.97 | |
| MA20: | 84.54 | |
| MA50: | 85.66 | |
| MA100: | 83.13 | |
| MAexp7: | 85.79 | |
| MAexp20: | 84.57 | |
| MAexp50: | 83.23 | |
| MAexp100: | 79.23 | |
| Price / MA7: | +3.96% | |
| Price / MA20: | +6.94% | |
| Price / MA50: | +5.55% | |
| Price / MA100: | +8.76% | |
| Price / MAexp7: | +5.39% | |
| Price / MAexp20: | +6.91% | |
| Price / MAexp50: | +8.63% | |
| Price / MAexp100: | +14.11% |
News
The latest news and videos published on BOOZ ALLEN HAMILTON HOLDING at the time of the analysis were as follows:
- Booz Allen Hamilton to Host Conference Call to Discuss Third Quarter Fiscal 2022 Results on Friday, January 28, 2022
- Booz Allen Opens Additional Hawaii Facility to Support Critical Indo-Pacific Missions
- Booz Allen Announces Modzy® Spinout
- Booz Allen Opens New 5G Lab in Central Maryland to Meet Critical Client Missions and Enhance R&D Capabilities
- Booz Allen Hamilton Partners with U.S. Air Force to Commercialize Platform One
About author

Online


Add a comment
Comments
0 comments on the analysis BOOZ ALLEN HAMILTON HOLDING - Weekly