EATON CORP. - 1H - Technical analysis published on 08/29/2024 (GMT)
- 172
- 0
Click here for a new analysis!
- Timeframe : 1H
- - Analysis generated on
- Status : LEVEL MAINTAINED
Summary of the analysis

Additional analysis
Quotes
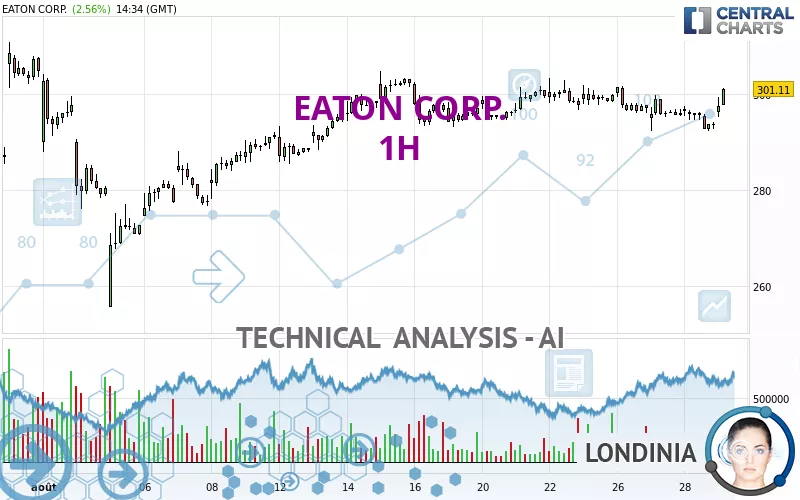
The EATON CORP. rating is 300.95 USD. The price registered an increase of +2.50% on the session and was between 295.14 USD and 301.31 USD. This implies that the price is at +1.97% from its lowest and at -0.12% from its highest.The Central Gaps scanner detects a bullish opening. A small advantage for buyers in the very short term.
Bullish opening
Type : Bullish
Timeframe : Openning
A study of price movements over other periods shows the following variations:
Near a new HIGH record (1 month)
Type : Bullish
Timeframe : Weekly
Technical
Technical analysis of this 1H chart of EATON CORP. indicates that the overall trend is strongly bullish. The signals given by the moving averages are 82.14% bullish. This strong bullish trend is confirmed by the strong signals currently being given by short-term moving averages. The Central Indicators market scanner is currently detecting several bullish signals that could impact this trend:
Bullish trend reversal : Moving Average 50
Type : Bullish
Timeframe : 1 hour
Bullish trend reversal : adaptative moving average 20
Type : Bullish
Timeframe : 1 hour
Bullish trend reversal : adaptative moving average 50
Type : Bullish
Timeframe : 1 hour
Bullish trend reversal : adaptative moving average 100
Type : Bullish
Timeframe : 1 hour
Bullish price crossover with Moving Average 50
Type : Bullish
Timeframe : 1 hour
In fact, according to the parameters integrated into the Central Analyzer system, 12 technical indicators out of 18 analysed are currently bullish. But beware of excesses. The Central Indicators scanner currently detects this:
CCI indicator is overbought : over 100
Type : Neutral
Timeframe : 1 hour
Williams %R indicator is overbought : over -20
Type : Neutral
Timeframe : 1 hour
Pivot points : price is over resistance 2
Type : Neutral
Timeframe : 1 hour
MACD crosses UP its Moving Average
Type : Bullish
Timeframe : 1 hour
Aroon indicator bullish trend
Type : Bullish
Timeframe : 1 hour
Ichimoku : price is over the cloud
Type : Bullish
Timeframe : 1 hour
SuperTrend indicator bullish reversal
Type : Bullish
Timeframe : 1 hour
Central Patterns, the market scanner focusing on chart patterns, resistances and supports found this result:
Resistance of channel is broken
Type : Bullish
Timeframe : 1 hour
The Central Candlesticks scanner which studies Japanese candlesticks did not detect anything.
| S3 | S2 | S1 | Price | R1 | R2 | R3 | |
|---|---|---|---|---|---|---|---|
| ProTrendLines | 255.65 | 272.52 | 290.85 | 300.95 | 301.78 | 312.41 | 324.24 |
| Change (%) | -15.05% | -9.45% | -3.36% | - | +0.28% | +3.81% | +7.74% |
| Change | -45.30 | -28.43 | -10.10 | - | +0.83 | +11.46 | +23.29 |
| Level | Minor | Major | Major | - | Intermediate | Major | Minor |
Pivot points can also be used to set your price objectives. Here is the price situation in relation to pivot points:
| Pivot points | S3 | S2 | S1 | PP | R1 | R2 | R3 |
|---|---|---|---|---|---|---|---|
| Standard | 286.13 | 289.18 | 291.39 | 294.44 | 296.65 | 299.70 | 301.91 |
| Camarilla | 292.15 | 292.64 | 293.12 | 293.60 | 294.08 | 294.56 | 295.05 |
| Woodie | 285.71 | 288.97 | 290.97 | 294.23 | 296.23 | 299.49 | 301.49 |
| Fibonacci | 289.18 | 291.19 | 292.43 | 294.44 | 296.45 | 297.69 | 299.70 |
| Pivot points | S3 | S2 | S1 | PP | R1 | R2 | R3 |
|---|---|---|---|---|---|---|---|
| Standard | 284.12 | 288.65 | 294.33 | 298.86 | 304.54 | 309.07 | 314.75 |
| Camarilla | 297.19 | 298.13 | 299.06 | 300.00 | 300.94 | 301.87 | 302.81 |
| Woodie | 284.69 | 288.94 | 294.90 | 299.15 | 305.11 | 309.36 | 315.32 |
| Fibonacci | 288.65 | 292.55 | 294.96 | 298.86 | 302.76 | 305.17 | 309.07 |
| Pivot points | S3 | S2 | S1 | PP | R1 | R2 | R3 |
|---|---|---|---|---|---|---|---|
| Standard | 231.38 | 257.95 | 280.86 | 307.43 | 330.34 | 356.91 | 379.82 |
| Camarilla | 290.16 | 294.70 | 299.23 | 303.77 | 308.31 | 312.84 | 317.38 |
| Woodie | 229.55 | 257.04 | 279.03 | 306.52 | 328.51 | 356.00 | 377.99 |
| Fibonacci | 257.95 | 276.85 | 288.53 | 307.43 | 326.33 | 338.01 | 356.91 |
Numerical data
The following is the status of technical indicators and moving averages registered at the time this technical analysis was created:
| RSI (14): | 59.05 | |
| MACD (12,26,9): | -0.4300 | |
| Directional Movement: | 9.52 | |
| AROON (14): | 21.43 | |
| DEMA (21): | 295.83 | |
| Parabolic SAR (0,02-0,02-0,2): | 292.38 | |
| Elder Ray (13): | 2.68 | |
| Super Trend (3,10): | 291.65 | |
| Zig ZAG (10): | 300.09 | |
| VORTEX (21): | 0.9800 | |
| Stochastique (14,3,5): | 62.54 | |
| TEMA (21): | 295.83 | |
| Williams %R (14): | -3.45 | |
| Chande Momentum Oscillator (20): | 4.29 | |
| Repulse (5,40,3): | 1.4900 | |
| ROCnROLL: | 1 | |
| TRIX (15,9): | -0.0400 | |
| Courbe Coppock: | 0.67 |
| MA7: | 297.80 | |
| MA20: | 292.23 | |
| MA50: | 304.80 | |
| MA100: | 313.54 | |
| MAexp7: | 296.64 | |
| MAexp20: | 296.48 | |
| MAexp50: | 296.80 | |
| MAexp100: | 296.55 | |
| Price / MA7: | +1.06% | |
| Price / MA20: | +2.98% | |
| Price / MA50: | -1.26% | |
| Price / MA100: | -4.02% | |
| Price / MAexp7: | +1.45% | |
| Price / MAexp20: | +1.51% | |
| Price / MAexp50: | +1.40% | |
| Price / MAexp100: | +1.48% |
News
The last news published on EATON CORP. at the time of the generation of this analysis was as follows:
- Eaton Recognized in Three Countries as a Best Place To Work for Disability Inclusion
- Simplifying Data Center Sustainability Governance
- Eaton Making Significant Progress on Sustainability Targets and I&D Journey As Outlined in Two New Publications
- Eaton Advances Clean Energy Projects Powering Its Global Operations in the Next Two Years
- Eaton Helps University of Notre Dame Build New EV Charging Network
About author
Online


Add a comment
Comments
0 comments on the analysis EATON CORP. - 1H