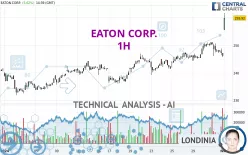
EATON CORP. - 1H - Technical analysis published on 02/01/2024 (GMT)
- 180
- 0
- Timeframe : 1H
- - Analysis generated on
- Status : WITHOUT TARGET

Summary of the analysis

Additional analysis
Quotes
The EATON CORP. rating is 261.00 USD. The price has increased by +6.06% since the last closing with the lowest point at 255.46 USD and the highest point at 261.68 USD. The deviation from the price is +2.17% for the low point and -0.26% for the high point.A bullish opening was detected by the Central Gaps scanner. Buyers are trying to impose a bullish momentum in the very short term.
Bullish opening
Type : Bullish
Timeframe : Openning
So that you have an overall view of the price change, here is a table showing the variations over several periods:
New HIGH record (5 years)
Type : Bullish
Timeframe : Weekly
Near a new HIGH record (1 year)
Type : Bullish
Timeframe : Weekly
Near a new HIGH record (1st january)
Type : Bullish
Timeframe : Weekly
Near a new HIGH record (1 month)
Type : Bullish
Timeframe : Weekly
Technical
Technical analysis of EATON CORP. in 1H shows a strongly overall bullish trend. 92.86% of the signals given by moving averages are bullish. The overall trend is supported by the strong bullish signals from short-term moving averages. The Central Indicators market scanner is currently detecting several bullish signals that could impact this trend:
Bullish price crossover with Moving Average 20
Type : Bullish
Timeframe : 1 hour
Bullish price crossover with adaptative moving average 20
Type : Bullish
Timeframe : 1 hour
An assessment of technical indicators shows a moderate bullish signal.
Caution: the Central Indicators scanner currently detects an excess:
Williams %R indicator is oversold : under -80
Type : Neutral
Timeframe : 1 hour
Pivot points : price is over resistance 3
Type : Neutral
Timeframe : 1 hour
An analysis of the price chart with the Central Patterns scanner (detector of chart patterns and resistances and supports) shows a result that can have an impact on the price change:
Support of channel is broken
Type : Bearish
Timeframe : 1 hour
No result was found by the Central Candlesticks scanner on Japanese candlesticks.
| S3 | S2 | S1 | Price | |
|---|---|---|---|---|
| ProTrendLines | 244.31 | 246.95 | 251.14 | 261.00 |
| Change (%) | -6.39% | -5.38% | -3.78% | - |
| Change | -16.69 | -14.05 | -9.86 | - |
| Level | Intermediate | Intermediate | Minor | - |
To determine price objectives, it is also possible to use the pivot points. Here is the price position in relation to pivot points:
| Pivot points | S3 | S2 | S1 | PP | R1 | R2 | R3 |
|---|---|---|---|---|---|---|---|
| Standard | 239.28 | 242.47 | 244.27 | 247.46 | 249.26 | 252.45 | 254.25 |
| Camarilla | 244.71 | 245.17 | 245.62 | 246.08 | 246.54 | 247.00 | 247.45 |
| Woodie | 238.60 | 242.12 | 243.59 | 247.11 | 248.58 | 252.10 | 253.57 |
| Fibonacci | 242.47 | 244.37 | 245.55 | 247.46 | 249.36 | 250.54 | 252.45 |
| Pivot points | S3 | S2 | S1 | PP | R1 | R2 | R3 |
|---|---|---|---|---|---|---|---|
| Standard | 232.48 | 235.82 | 240.86 | 244.20 | 249.24 | 252.58 | 257.62 |
| Camarilla | 243.59 | 244.35 | 245.12 | 245.89 | 246.66 | 247.43 | 248.20 |
| Woodie | 233.32 | 236.25 | 241.70 | 244.63 | 250.08 | 253.01 | 258.46 |
| Fibonacci | 235.82 | 239.02 | 241.00 | 244.20 | 247.40 | 249.38 | 252.58 |
| Pivot points | S3 | S2 | S1 | PP | R1 | R2 | R3 |
|---|---|---|---|---|---|---|---|
| Standard | 215.60 | 223.72 | 234.90 | 243.02 | 254.20 | 262.32 | 273.50 |
| Camarilla | 240.77 | 242.54 | 244.31 | 246.08 | 247.85 | 249.62 | 251.39 |
| Woodie | 217.13 | 224.49 | 236.43 | 243.79 | 255.73 | 263.09 | 275.03 |
| Fibonacci | 223.72 | 231.09 | 235.65 | 243.02 | 250.39 | 254.95 | 262.32 |
Numerical data
The following are the details of the technical indicators and moving averages that were collected to generate this technical analysis:
| RSI (14): | 77.42 | |
| MACD (12,26,9): | 1.3600 | |
| Directional Movement: | 30.77 | |
| AROON (14): | 7.14 | |
| DEMA (21): | 250.73 | |
| Parabolic SAR (0,02-0,02-0,2): | 245.66 | |
| Elder Ray (13): | 8.28 | |
| Super Trend (3,10): | 249.27 | |
| Zig ZAG (10): | 259.99 | |
| VORTEX (21): | 1.0400 | |
| Stochastique (14,3,5): | 43.60 | |
| TEMA (21): | 251.38 | |
| Williams %R (14): | -2.37 | |
| Chande Momentum Oscillator (20): | 11.05 | |
| Repulse (5,40,3): | 2.0700 | |
| ROCnROLL: | 1 | |
| TRIX (15,9): | 0.0700 | |
| Courbe Coppock: | 1.87 |
| MA7: | 248.50 | |
| MA20: | 243.09 | |
| MA50: | 237.09 | |
| MA100: | 224.77 | |
| MAexp7: | 251.07 | |
| MAexp20: | 248.84 | |
| MAexp50: | 246.67 | |
| MAexp100: | 244.29 | |
| Price / MA7: | +5.03% | |
| Price / MA20: | +7.37% | |
| Price / MA50: | +10.08% | |
| Price / MA100: | +16.12% | |
| Price / MAexp7: | +3.96% | |
| Price / MAexp20: | +4.89% | |
| Price / MAexp50: | +5.81% | |
| Price / MAexp100: | +6.84% |
News
The last news published on EATON CORP. at the time of the generation of this analysis was as follows:
- Eaton Receives Dual Honors for Its Commitment to Inclusion and Diversity
- Eaton Awarded Contract To Help Miami-Dade County Improve Sustainability, Resilience and Safety of Critical Wastewater Treatment Facility
- Eaton Advances the Energy Transition and Boosts Education Partnerships With New Montreal Innovation Center
- Electrification: Powering Next-Generation Transportation and Much More
- Eaton’s Focus on “Unleashing the Power of Diverse Perspectives” Highlighted in New Report
About author
Online


Add a comment
Comments
0 comments on the analysis EATON CORP. - 1H