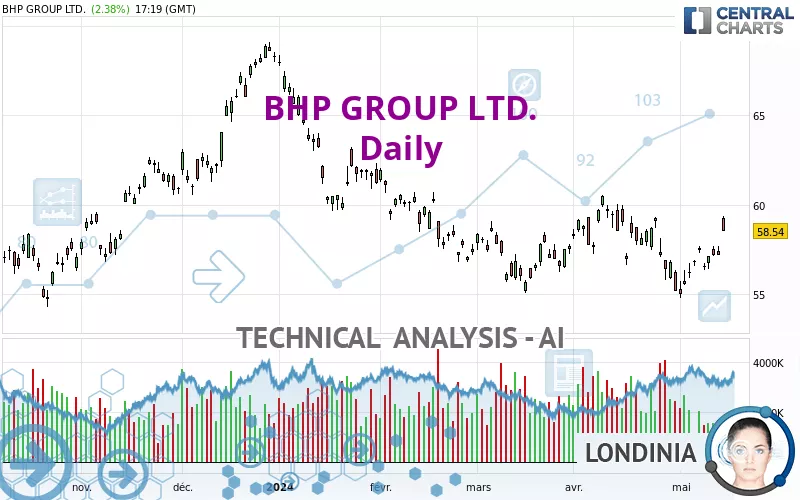
BHP GROUP LTD. - Daily - Technical analysis published on 05/14/2024 (GMT)
- 121
- 0
Click here for a new analysis!
- Timeframe : Daily
- - Analysis generated on
- Status : TARGET REACHED

Summary of the analysis

Additional analysis
Quotes
The BHP GROUP LTD. rating is 58.54 USD. The price has increased by +2.38% since the last closing and was between 58.51 USD and 59.38 USD. This implies that the price is at +0.05% from its lowest and at -1.41% from its highest.The Central Gaps scanner detects a bullish gap which is a sign that buyers have taken the lead in the very short term.
Opening Gap UP
Type : Bullish
Timeframe : Openning
Here is a more detailed summary of the historical variations registered by BHP GROUP LTD.:
Near a new HIGH record (1 month)
Type : Bullish
Timeframe : Weekly
Technical
Technical analysis of this Daily chart of BHP GROUP LTD. indicates that the overall trend is slightly bullish. 57.14% of the signals given by moving averages are bullish. This slightly bullish trend could be reinforced by the strong bullish signals given by short-term moving averages. An assessment of moving averages reveals several bullish signals that could impact this trend:
Bullish price crossover with Moving Average 50
Type : Bullish
Timeframe : Daily
Bullish price crossover with adaptative moving average 20
Type : Bullish
Timeframe : Daily
Bullish price crossover with adaptative moving average 50
Type : Bullish
Timeframe : Daily
Bullish price crossover with adaptative moving average 100
Type : Bullish
Timeframe : Daily
In fact, according to the parameters integrated into the Central Analyzer system, 12 technical indicators out of 18 analysed are currently bullish. Caution: the Central Indicators scanner currently detects an excess:
CCI indicator is overbought : over 100
Type : Neutral
Timeframe : Daily
Williams %R indicator is overbought : over -20
Type : Neutral
Timeframe : Daily
Pivot points : price is over resistance 2
Type : Neutral
Timeframe : Weekly
Pivot points : price is over resistance 3
Type : Neutral
Timeframe : Daily
RSI indicator is back over 50
Type : Bullish
Timeframe : Daily
Aroon indicator bullish trend
Type : Bullish
Timeframe : Daily
Ichimoku : price is over the cloud
Type : Bullish
Timeframe : Daily
Momentum indicator is back over 0
Type : Bullish
Timeframe : Daily
Central Patterns, the market scanner focusing on chart patterns, resistances and supports found these results:
Near horizontal resistance
Type : Bearish
Timeframe : Daily
Resistance of channel is broken
Type : Bullish
Timeframe : Daily
The Central Candlesticks scanner which studies Japanese candlesticks did not detect anything.
| S3 | S2 | S1 | Price | R1 | R2 | |
|---|---|---|---|---|---|---|
| ProTrendLines | 53.55 | 55.67 | 56.98 | 58.54 | 59.91 | 67.51 |
| Change (%) | -8.52% | -4.90% | -2.66% | - | +2.34% | +15.32% |
| Change | -4.99 | -2.87 | -1.56 | - | +1.37 | +8.97 |
| Level | Intermediate | Major | Major | - | Major | Major |
Attention could also be paid to pivot points to set price objectives:
| Pivot points | S3 | S2 | S1 | PP | R1 | R2 | R3 |
|---|---|---|---|---|---|---|---|
| Standard | 56.51 | 56.84 | 57.01 | 57.34 | 57.51 | 57.84 | 58.01 |
| Camarilla | 57.04 | 57.09 | 57.13 | 57.18 | 57.23 | 57.27 | 57.32 |
| Woodie | 56.43 | 56.80 | 56.93 | 57.30 | 57.43 | 57.80 | 57.93 |
| Fibonacci | 56.84 | 57.03 | 57.15 | 57.34 | 57.53 | 57.65 | 57.84 |
| Pivot points | S3 | S2 | S1 | PP | R1 | R2 | R3 |
|---|---|---|---|---|---|---|---|
| Standard | 55.10 | 55.72 | 56.46 | 57.08 | 57.82 | 58.44 | 59.18 |
| Camarilla | 56.82 | 56.94 | 57.07 | 57.19 | 57.32 | 57.44 | 57.56 |
| Woodie | 55.15 | 55.75 | 56.51 | 57.11 | 57.87 | 58.47 | 59.23 |
| Fibonacci | 55.72 | 56.24 | 56.56 | 57.08 | 57.60 | 57.92 | 58.44 |
| Pivot points | S3 | S2 | S1 | PP | R1 | R2 | R3 |
|---|---|---|---|---|---|---|---|
| Standard | 47.99 | 51.57 | 53.37 | 56.95 | 58.75 | 62.33 | 64.13 |
| Camarilla | 53.68 | 54.17 | 54.67 | 55.16 | 55.65 | 56.15 | 56.64 |
| Woodie | 47.09 | 51.13 | 52.47 | 56.51 | 57.85 | 61.89 | 63.23 |
| Fibonacci | 51.57 | 53.63 | 54.90 | 56.95 | 59.01 | 60.28 | 62.33 |
Numerical data
The following are the details of the technical indicators and moving averages that were collected to generate this technical analysis:
| RSI (14): | 56.76 | |
| MACD (12,26,9): | -0.1300 | |
| Directional Movement: | 10.86 | |
| AROON (14): | 64.29 | |
| DEMA (21): | 57.04 | |
| Parabolic SAR (0,02-0,02-0,2): | 54.92 | |
| Elder Ray (13): | 1.76 | |
| Super Trend (3,10): | 59.08 | |
| Zig ZAG (10): | 58.56 | |
| VORTEX (21): | 0.8800 | |
| Stochastique (14,3,5): | 62.80 | |
| TEMA (21): | 57.05 | |
| Williams %R (14): | -17.61 | |
| Chande Momentum Oscillator (20): | 2.15 | |
| Repulse (5,40,3): | -2.3800 | |
| ROCnROLL: | 1 | |
| TRIX (15,9): | -0.0800 | |
| Courbe Coppock: | 3.01 |
| MA7: | 57.27 | |
| MA20: | 57.21 | |
| MA50: | 57.46 | |
| MA100: | 58.97 | |
| MAexp7: | 57.34 | |
| MAexp20: | 57.26 | |
| MAexp50: | 57.63 | |
| MAexp100: | 58.02 | |
| Price / MA7: | +2.22% | |
| Price / MA20: | +2.32% | |
| Price / MA50: | +1.88% | |
| Price / MA100: | -0.73% | |
| Price / MAexp7: | +2.09% | |
| Price / MAexp20: | +2.24% | |
| Price / MAexp50: | +1.58% | |
| Price / MAexp100: | +0.90% |
About author
Online


Add a comment
Comments
0 comments on the analysis BHP GROUP LTD. - Daily