BHP GROUP LTD. - 1H - Technical analysis published on 11/15/2023 (GMT)
- 122
- 0
Click here for a new analysis!
- Timeframe : 1H
- - Analysis generated on
- Status : TARGET REACHED

Summary of the analysis

Additional analysis
Quotes
BHP GROUP LTD. rating 60.62 USD. The price is lower by -0.05% since the last closing and was traded between 60.49 USD and 61.04 USD over the period. The price is currently at +0.21% from its lowest and -0.69% from its highest.So that you have an overall view of the price change, here is a table showing the variations over several periods:
New HIGH record (1 month)
Type : Bullish
Timeframe : Weekly
Technical
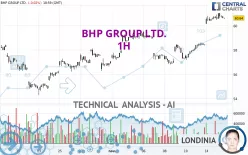
A technical analysis in 1H of this BHP GROUP LTD. chart shows a strongly bullish trend. 92.86% of the signals given by moving averages are bullish. The overall trend is supported by the strong bullish signals from short-term moving averages. There is no crossing of moving average by the price or crossing of moving averages between themselves.
In fact, 12 technical indicators on 18 studied are currently bullish. Caution: the Central Indicators scanner currently detects an excess:
RSI indicator is overbought : over 70
Type : Neutral
Timeframe : 1 hour
Williams %R indicator is overbought : over -20
Type : Neutral
Timeframe : 1 hour
Pivot points : price is over resistance 1
Type : Neutral
Timeframe : Weekly
Central Patterns, the market scanner focusing on chart patterns, resistances and supports found these results:
Near horizontal resistance
Type : Bearish
Timeframe : 1 hour
Near resistance of channel
Type : Bearish
Timeframe : 1 hour
The Central Candlesticks scanner, specialised in Japanese candlesticks, did not identify any signals.
| S3 | S2 | S1 | Price | R1 | R2 | R3 | |
|---|---|---|---|---|---|---|---|
| ProTrendLines | 57.21 | 58.40 | 59.59 | 60.62 | 60.81 | 61.42 | 62.43 |
| Change (%) | -5.63% | -3.66% | -1.70% | - | +0.31% | +1.32% | +2.99% |
| Change | -3.41 | -2.22 | -1.03 | - | +0.19 | +0.80 | +1.81 |
| Level | Minor | Major | Minor | - | Intermediate | Major | Minor |
To determine price objectives, it is also possible to use the pivot points. Here is the price position in relation to pivot points:
| Pivot points | S3 | S2 | S1 | PP | R1 | R2 | R3 |
|---|---|---|---|---|---|---|---|
| Standard | 59.59 | 59.86 | 60.26 | 60.53 | 60.93 | 61.20 | 61.60 |
| Camarilla | 60.47 | 60.53 | 60.59 | 60.65 | 60.71 | 60.77 | 60.83 |
| Woodie | 59.65 | 59.89 | 60.32 | 60.56 | 60.99 | 61.23 | 61.66 |
| Fibonacci | 59.86 | 60.12 | 60.28 | 60.53 | 60.79 | 60.95 | 61.20 |
| Pivot points | S3 | S2 | S1 | PP | R1 | R2 | R3 |
|---|---|---|---|---|---|---|---|
| Standard | 53.94 | 55.38 | 56.72 | 58.16 | 59.50 | 60.94 | 62.28 |
| Camarilla | 57.31 | 57.56 | 57.82 | 58.07 | 58.33 | 58.58 | 58.84 |
| Woodie | 53.90 | 55.36 | 56.68 | 58.14 | 59.46 | 60.92 | 62.24 |
| Fibonacci | 55.38 | 56.44 | 57.10 | 58.16 | 59.22 | 59.88 | 60.94 |
| Pivot points | S3 | S2 | S1 | PP | R1 | R2 | R3 |
|---|---|---|---|---|---|---|---|
| Standard | 50.59 | 52.43 | 54.75 | 56.59 | 58.91 | 60.75 | 63.07 |
| Camarilla | 55.92 | 56.30 | 56.68 | 57.06 | 57.44 | 57.82 | 58.20 |
| Woodie | 50.82 | 52.55 | 54.98 | 56.71 | 59.14 | 60.87 | 63.30 |
| Fibonacci | 52.43 | 54.02 | 55.00 | 56.59 | 58.18 | 59.16 | 60.75 |
Numerical data
The following are the details of the technical indicators and moving averages that were collected to generate this technical analysis:
| RSI (14): | 70.56 | |
| MACD (12,26,9): | 0.7300 | |
| Directional Movement: | 31.37 | |
| AROON (14): | 71.42 | |
| DEMA (21): | 60.84 | |
| Parabolic SAR (0,02-0,02-0,2): | 60.28 | |
| Elder Ray (13): | 0.39 | |
| Super Trend (3,10): | 59.72 | |
| Zig ZAG (10): | 60.67 | |
| VORTEX (21): | 1.1500 | |
| Stochastique (14,3,5): | 88.45 | |
| TEMA (21): | 61.22 | |
| Williams %R (14): | -15.13 | |
| Chande Momentum Oscillator (20): | 2.25 | |
| Repulse (5,40,3): | -0.1600 | |
| ROCnROLL: | 1 | |
| TRIX (15,9): | 0.1700 | |
| Courbe Coppock: | 7.39 |
| MA7: | 58.52 | |
| MA20: | 57.62 | |
| MA50: | 57.02 | |
| MA100: | 57.29 | |
| MAexp7: | 60.65 | |
| MAexp20: | 59.91 | |
| MAexp50: | 59.00 | |
| MAexp100: | 58.33 | |
| Price / MA7: | +3.59% | |
| Price / MA20: | +5.21% | |
| Price / MA50: | +6.31% | |
| Price / MA100: | +5.81% | |
| Price / MAexp7: | -0.05% | |
| Price / MAexp20: | +1.19% | |
| Price / MAexp50: | +2.75% | |
| Price / MAexp100: | +3.93% |
About author
Online


Add a comment
Comments
0 comments on the analysis BHP GROUP LTD. - 1H