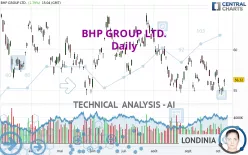
BHP GROUP LTD. - Daily - Technical analysis published on 10/06/2023 (GMT)
- 173
- 0
Click here for a new analysis!
- Timeframe : Daily
- - Analysis generated on
- Status : LEVEL MAINTAINED

Summary of the analysis

Additional analysis
Quotes
BHP GROUP LTD. rating 56.32 USD. On the day, this instrument gained +1.79% with the lowest point at 55.53 USD and the highest point at 56.44 USD. The deviation from the price is +1.42% for the low point and -0.21% for the high point.A bullish gap was detected at the opening by the Central Gaps scanner. There are a lot of buyers and they have the upper hand in the very short term.
Opening Gap UP
Type : Bullish
Timeframe : Openning
A study of price movements over other periods shows the following variations:
Near a new LOW record (1st january)
Type : Bearish
Timeframe : Weekly
Near a new LOW record (1 month)
Type : Bearish
Timeframe : Weekly
Technical
A technical analysis in Daily of this BHP GROUP LTD. chart shows a bearish trend. 75.00% of the signals given by moving averages are bearish. Caution: as the signals currently given by short-term moving averages are rather neutral, the bearish trend could slow down. An assessment of moving averages reveals a bullish signal that could impact this trend:
Moving Average bullish crossovers : MA20 & MA50
Type : Bullish
Timeframe : Daily
On the 18 technical indicators analysed, 6 are bullish, 6 are neutral and 6 are bearish. Caution: the Central Indicators scanner currently detects an excess:
MACD indicator: bullish divergence
Type : Bullish
Timeframe : Daily
Pivot points : price is over resistance 3
Type : Neutral
Timeframe : Daily
Price is back under the pivot point
Type : Bearish
Timeframe : Weekly
An analysis of the price chart with the Central Patterns scanner (detector of chart patterns and resistances and supports) shows a result that can have an impact on the price change:
Near horizontal resistance
Type : Bearish
Timeframe : Daily
For a small rebound in the very short term, the Central Candlesticks scanner currently notes the presence of this bullish pattern in Japanese candlesticks:
Upside gap
Type : Bullish
Timeframe : Daily
| S3 | S2 | S1 | Price | R1 | R2 | R3 | |
|---|---|---|---|---|---|---|---|
| ProTrendLines | 42.37 | 53.13 | 55.92 | 56.32 | 58.41 | 61.42 | 69.29 |
| Change (%) | -24.77% | -5.66% | -0.71% | - | +3.71% | +9.06% | +23.03% |
| Change | -13.95 | -3.19 | -0.40 | - | +2.09 | +5.10 | +12.97 |
| Level | Intermediate | Major | Major | - | Major | Major | Major |
To determine price objectives, it is also possible to use the pivot points. Here is the price position in relation to pivot points:
| Pivot points | S3 | S2 | S1 | PP | R1 | R2 | R3 |
|---|---|---|---|---|---|---|---|
| Standard | 54.39 | 54.62 | 54.98 | 55.21 | 55.57 | 55.80 | 56.16 |
| Camarilla | 55.17 | 55.22 | 55.28 | 55.33 | 55.38 | 55.44 | 55.49 |
| Woodie | 54.45 | 54.65 | 55.04 | 55.24 | 55.63 | 55.83 | 56.22 |
| Fibonacci | 54.62 | 54.85 | 54.99 | 55.21 | 55.44 | 55.58 | 55.80 |
| Pivot points | S3 | S2 | S1 | PP | R1 | R2 | R3 |
|---|---|---|---|---|---|---|---|
| Standard | 52.74 | 53.84 | 55.36 | 56.46 | 57.98 | 59.08 | 60.60 |
| Camarilla | 56.16 | 56.40 | 56.64 | 56.88 | 57.12 | 57.36 | 57.60 |
| Woodie | 52.95 | 53.95 | 55.57 | 56.57 | 58.19 | 59.19 | 60.81 |
| Fibonacci | 53.84 | 54.84 | 55.46 | 56.46 | 57.46 | 58.08 | 59.08 |
| Pivot points | S3 | S2 | S1 | PP | R1 | R2 | R3 |
|---|---|---|---|---|---|---|---|
| Standard | 50.27 | 52.56 | 54.72 | 57.01 | 59.17 | 61.46 | 63.62 |
| Camarilla | 55.66 | 56.06 | 56.47 | 56.88 | 57.29 | 57.70 | 58.10 |
| Woodie | 50.21 | 52.53 | 54.66 | 56.98 | 59.11 | 61.43 | 63.56 |
| Fibonacci | 52.56 | 54.26 | 55.31 | 57.01 | 58.71 | 59.76 | 61.46 |
Numerical data
The following is the status of the technical indicators and moving averages at the time of publication of this technical analysis:
| RSI (14): | 50.55 | |
| MACD (12,26,9): | -0.2400 | |
| Directional Movement: | -0.82 | |
| AROON (14): | -85.71 | |
| DEMA (21): | 55.86 | |
| Parabolic SAR (0,02-0,02-0,2): | 57.62 | |
| Elder Ray (13): | -0.02 | |
| Super Trend (3,10): | 58.50 | |
| Zig ZAG (10): | 56.32 | |
| VORTEX (21): | 0.8400 | |
| Stochastique (14,3,5): | 25.19 | |
| TEMA (21): | 55.81 | |
| Williams %R (14): | -54.63 | |
| Chande Momentum Oscillator (20): | -1.19 | |
| Repulse (5,40,3): | 1.1200 | |
| ROCnROLL: | -1 | |
| TRIX (15,9): | -0.0300 | |
| Courbe Coppock: | 5.05 |
| MA7: | 55.92 | |
| MA20: | 56.52 | |
| MA50: | 56.46 | |
| MA100: | 57.27 | |
| MAexp7: | 55.79 | |
| MAexp20: | 56.14 | |
| MAexp50: | 56.60 | |
| MAexp100: | 57.12 | |
| Price / MA7: | +0.72% | |
| Price / MA20: | -0.35% | |
| Price / MA50: | -0.25% | |
| Price / MA100: | -1.66% | |
| Price / MAexp7: | +0.95% | |
| Price / MAexp20: | +0.32% | |
| Price / MAexp50: | -0.49% | |
| Price / MAexp100: | -1.40% |
About author
Online


Add a comment
Comments
0 comments on the analysis BHP GROUP LTD. - Daily